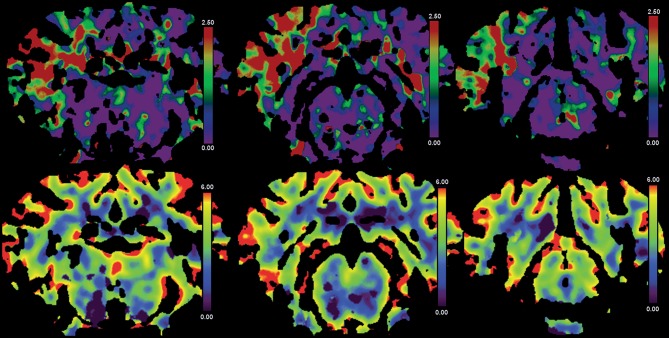
Figure 5.
Results from case 5. CTP images from case 5. Directly after clip MCAO profound hypoperfusion is visible on Tmax maps (upper panels) without reduction in CBV (lower panels). False color scale indicates Tmax from 0 (purple) to 2.5 s (red) in upper panels and CBV from 0 ml/100 g (purple) to 6 ml/100 g (red) in lower panels, respectively.

