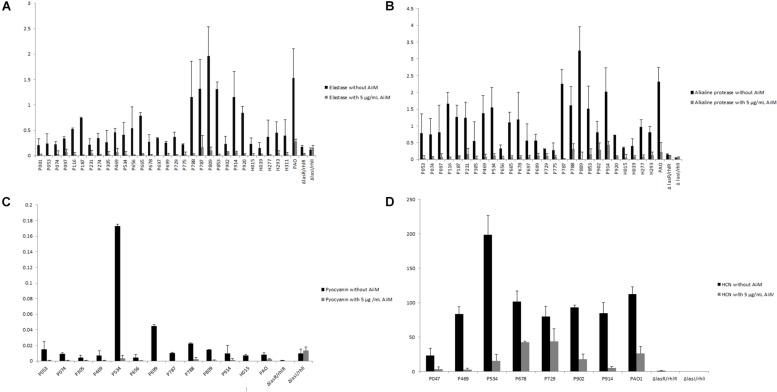
FIGURE 3.
(A) Elastase activity, black bars correspond to clinical strains determination without addition of AiiM, gray bars correspond to clinical strains with 5 μg/mL of AiiM with p = 0.000002. (B) Alkaline protease activity, black bars correspond to clinical strains without AiiM addition while gray bars correspond to strains with the addition of 5 μg/mL of AiiM with p = 0.000004. (C) Pyocyanin production, black bars correspond to clinical strains without AiiM addition, whereas gray bars correspond to clinical strains with AiiM 5 μg/mL with p = 0.001. (D) HCN production, black bars correspond to clinical strains without AiiM addition while gray bars correspond to clinical strains with AiiM 5 μg/mL having a p = 0.008.

