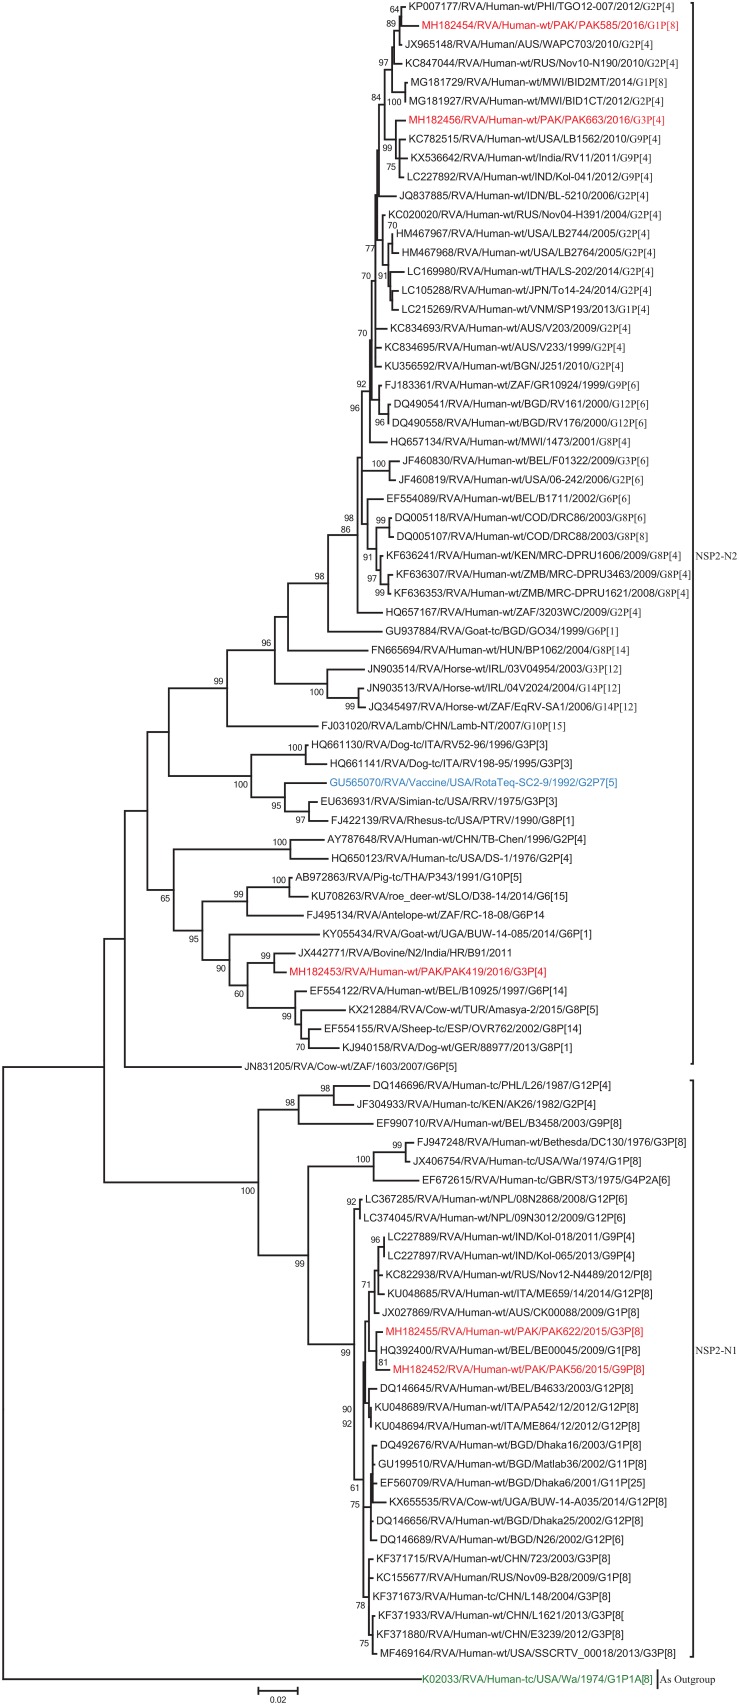
FIGURE 4.
Phylogenetic tree constructed from the nucleotide sequences of the NSP2 genes of the study strains and representative RVA strains. RVA strains sequenced in this study are represented by the red color. The vaccine strains and an out group strain are represented by Blue and green color, respectively while black shading represent strains isolated all over the world. The RVA strains sequenced in this study and reference strains obtained from GenBank database are represented by Accession number, Strain Name, Country and year of Isolation. Scale bar: 0.02 substitutions per nucleotide. Bootstrap values <60 are not shown.

