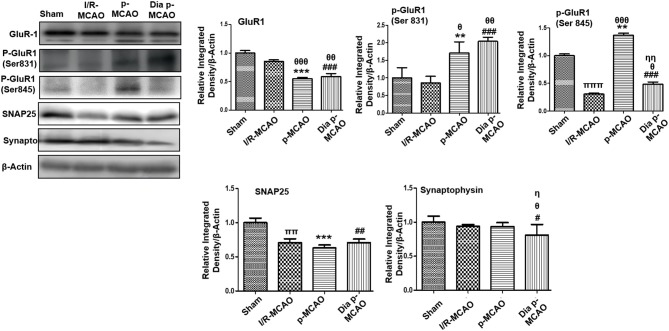
Figure 4.
Expression of glutamate neurotransmission and synaptic changes in various ischemic models western blot analysis of GluR1, p-GluR1 (Ser845, Ser831), SNAP25, Synaptophysin. Densitometric analysis was expressed in relative to β-Actin (n = 5/group). θp < 0.05 relative to I/R MCAO, ηp < 0.05 between p-MCAO and Dia p-MCAO. *p < 0.05, #p < 0.05, and πp < 0.05 relative to sham group. ***p < 0.001, **p < 0.01, ###p < 0.001, and ##p < 0.01. θθshows significant difference of p-MCAO and Dia p-MCAO to I/R, and its value is p < 0.01, θθθshows significant difference of p-MCAO and Dia p-MCAO to I/R, and its value is p < 0.001, ππshows significant difference of I/R MCAO to sham, and its value is p < 0.01, πππshows significant difference of I/R MCAO to sham, and its value is p < 0.001, ηηshows significant difference between p-MCAO and Dia p-MCAO, and its value is p < 0.01.

