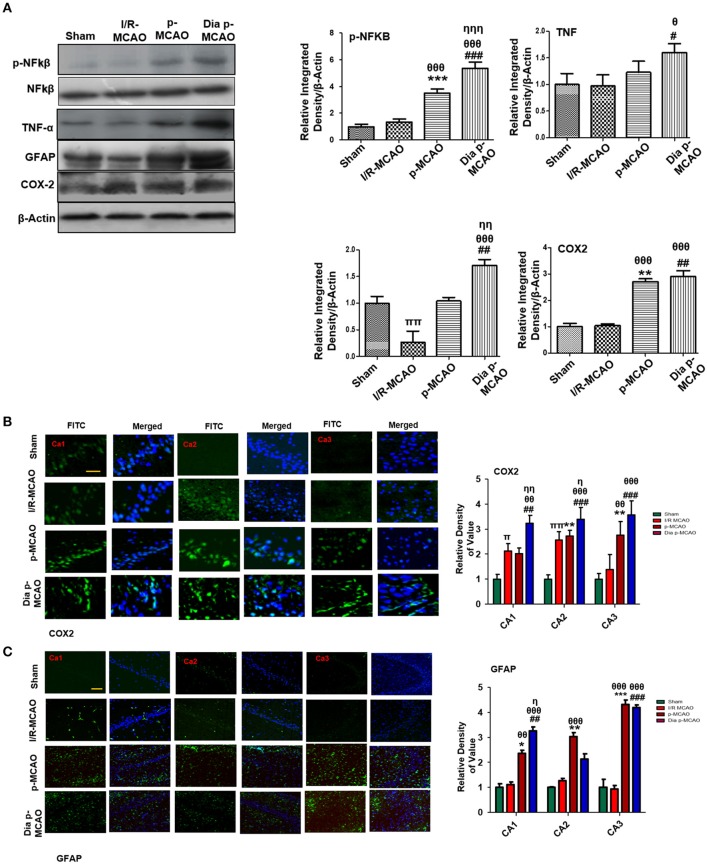
Figure 5.
Effect of ischemia on inflammatory related molecules in the hippocampus (A) Western blot analysis of p-NFκB, NFκB, TNFα, GFAP, and COX2. Densitometric analysis was expressed in relative to β-Actin (n = 5/group). (B) Representative photos of immunohistochemistry for COX2, scale bar = 100 μm, and (C) GFAP; scale bar = 30 μm, (n = 5/group). The CA1, CA2, and CA3 segments in p-MCAO and Dia p-MCAO showing elevated expression of COX2 and GFAP. θp < 0.05 relative to I/R MCAO, ηp < 0.05 between p-MCAO and Dia p-MCAO. *p < 0.05, #p < 0.05, and πp < 0.05 relative to sham group. ***p < 0.001, **p < 0.01, ###p < 0.001, and ##p < 0.01. θθshows significant difference of p-MCAO and Dia p-MCAO to I/R, and its value is p < 0.01, θθθshows significant difference of p-MCAO and Dia p-MCAO to I/R, and its value is p < 0.001, ηηshows significant difference between p-MCAO and Dia p-MCAO, and its value is p < 0.01, ηηηshows significant difference between p-MCAO and Dia p-MCAO, and its value is p < 0.001, ππshows significant difference of I/R MCAO to sham, and its value is p < 0.01.

