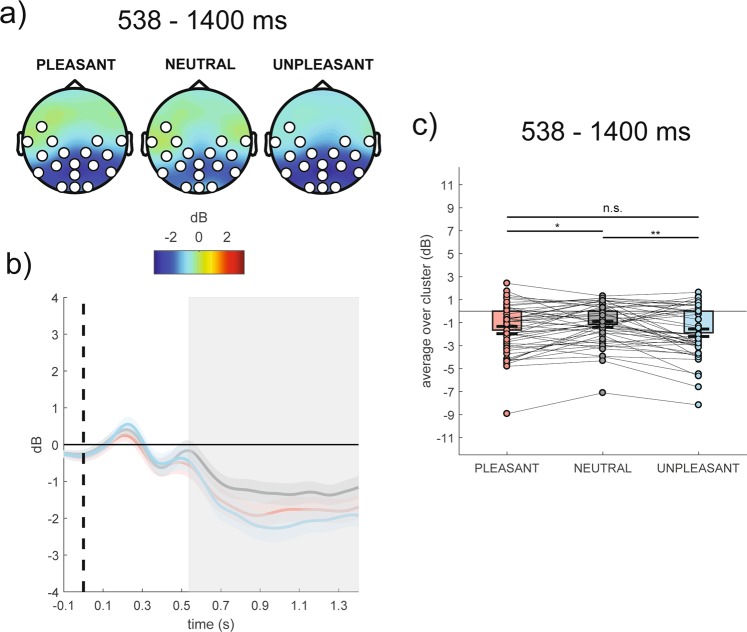
Figure 2.
(Panel a) Topography of the mean event-related alpha power (dB) averaged over the significant time points (538–1400 ms time window) for pleasant, neutral and unpleasant conditions. (Panel b) Time course of grand-average event-related alpha power averaged over the significant electrodes for pleasant (red line), neutral (grey line) and unpleasant (light blue line) conditions. Shaded areas represent ± standard error of the mean (SEM); the colored frame represents the significant time window (538–1400 ms). (Panel c) Mean event-related alpha power of each participant averaged over the significant electrodes and time points for pleasant, neutral and unpleasant conditions. Each circle represents one participant; colored frames represent the mean event-related alpha power across all participants and the solid black lines represent ± SEM. *p < 0.05; **p < 0.01.

