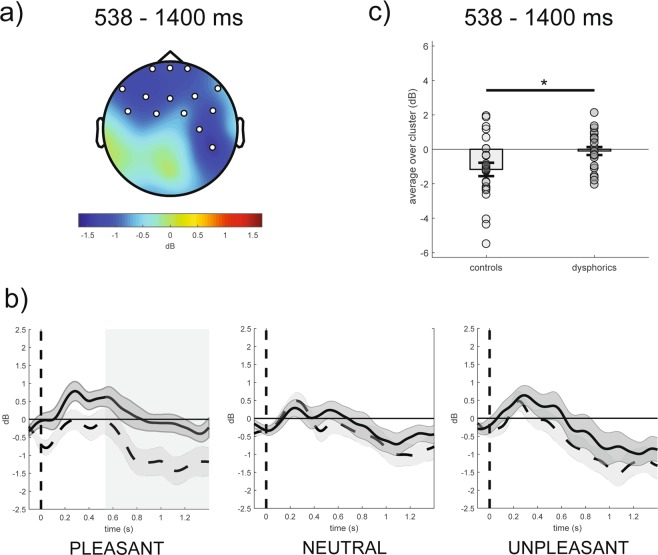
Figure 3.
(Panel a) Topography of the mean difference between groups in event-related alpha power (dB; group without dysphoria minus group with dysphoria) averaged over the significant time points (538–1400 ms time window) for the pleasant condition. (Panel b) Time course of grand-average event-related alpha power averaged over the significant electrodes for pleasant, neutral and unpleasant conditions in the group with dysphoria (solid line) and in the group without dysphoria (dashed line). Shaded areas represent ± standard error of the mean (SEM); the colored frame represents the significant time window (538–1400 ms). (Panel c) Mean event-related alpha power of each participant in the group with dysphoria and in the group without dysphoria (i.e., controls) averaged over the significant electrodes and time points for the pleasant condition. Each circle represents one participant; the frames represent the mean event-related alpha power across all participants in the group with dysphoria and in the group without dysphoria and the solid black lines represent ± SEM. *p < 0.05.

