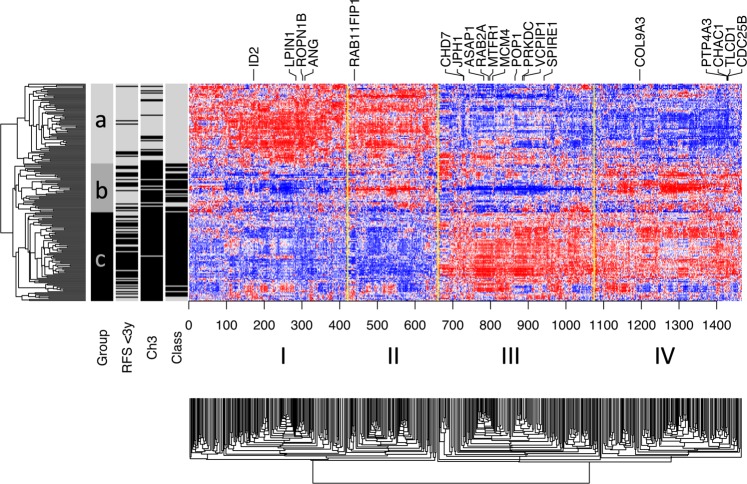
Figure 1.
Gene expression heatmap. Hierarchical clustering with Pearson’s correlation similarity and average linkage. Heatmap showing the 1466 genes associated with prognosis in the meta-analysis of Cox models (FDR < 0.05). We perceive four main clusters (I-IV). In addition to favorable (a) and unfavorable (c) patient groups, there seems to be an intermediate group (b), characterized by a distinct pattern of low expression in cluster I and III and high expression in clusters II and IV. Chromosome 3 loss, class 2 tumors and relapse before 3 years of follow-up are shown in black.

