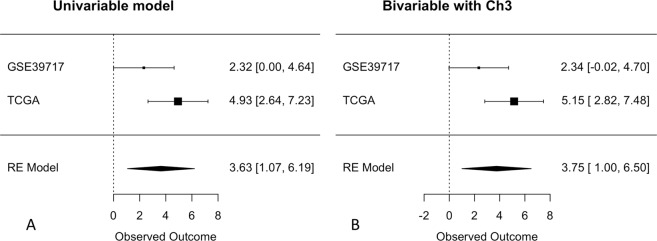
Figure 2.
Forest plot of univariable (A) and bivariable (B) Cox regression of the continuous risk score in uveal melanoma. Log hazard ratio estimates with standard error bars are shown horizontally for both datasets (upper part) and the meta-analysis (RE model, bottom part). The lack of association is at zero (dotted vertical line). There was a positive association in both the univariable and bivariable model, both statistically significant in the meta-analysis.

