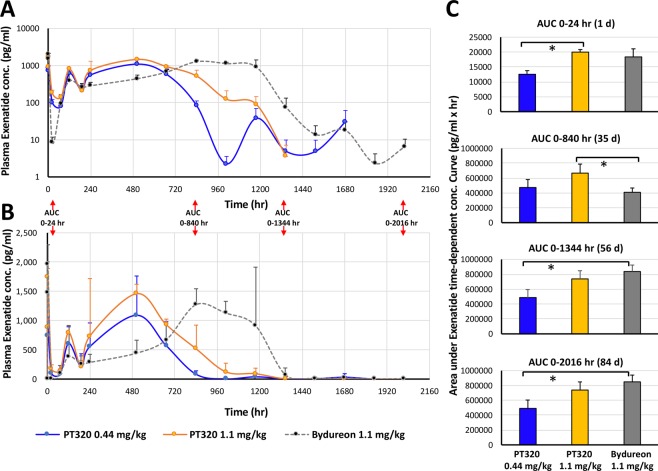
Figure 2.
Time-dependent plasma concentrations of Exenatide following a single subcutaneous dose of PT320 (0.44 or 1.1 mg/kg) or Bydureon (1.1 mg/kg) to nonhuman primates. (A) Classical semi-log plot of plasma Exenatide levels by treatment group from 30 min to 84 days (0.5 to 2016 hr). (B) Linear. Plot of the same data to emphasize the different times that steady-state Exenatide levels were achieved following administration of either PT320 (blue and orange lines) vs. Bydureon (gray). (C) Plot of AUC values at the times noted in (A and B). Values are means ± SEM, *p < 0.05.

