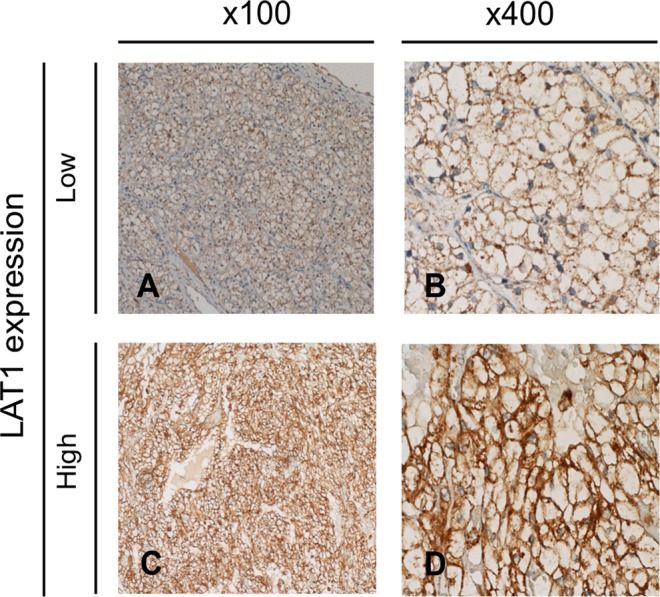
Figure 1.

Representative staining pictures showing LAT1 expression in RCC tissues. LAT1 expression in RCC tissues was analyzed by immunohistochemistry. A representative LAT1 immunostaining picture in the low LAT1 expression group is shown at 100-times magnification (panel A) and 400-times magnification (panel B). Similarly, a representative LAT1 immunostaining picture in the high LAT1 expression group is shown at 100-times magnification (panel C) and 400-times magnification (panel D).
