Figure 8.
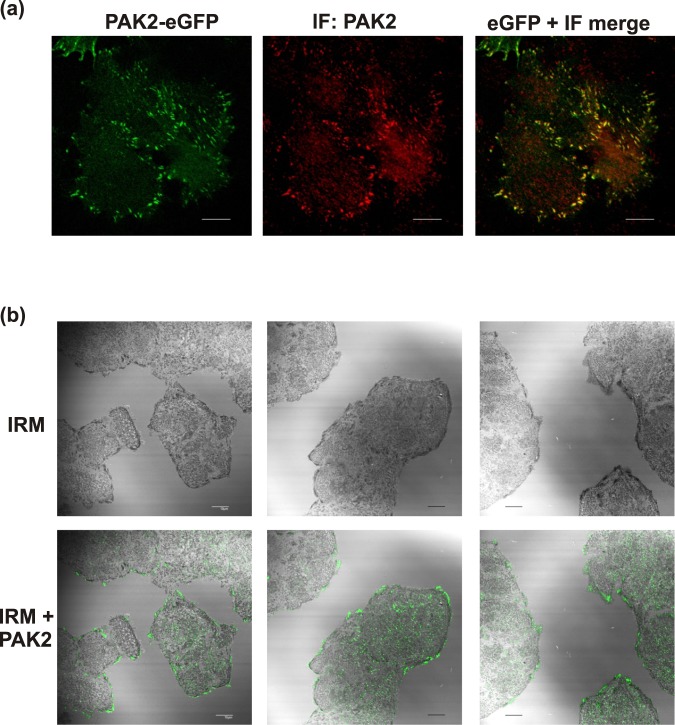
Analysis of endogenous PAK localization by immunofluorescence staining. (a) PAK2 antibody specificity control. The signal from PAK2 antibody, combined with an AlexaFluor647-conjugated secondary antibody, was compared with the eGFP signal in HeLa cells transfected with PAK2-eGFP. (b) Top: HeLa cell-surface adhesion points visualized by interference reflection microscopy (IRM) in untransfected cells. Bottom: PAK2 signal (green) is superposed on IRM signal from the same visual field. The scale bars correspond to 10 µm.

