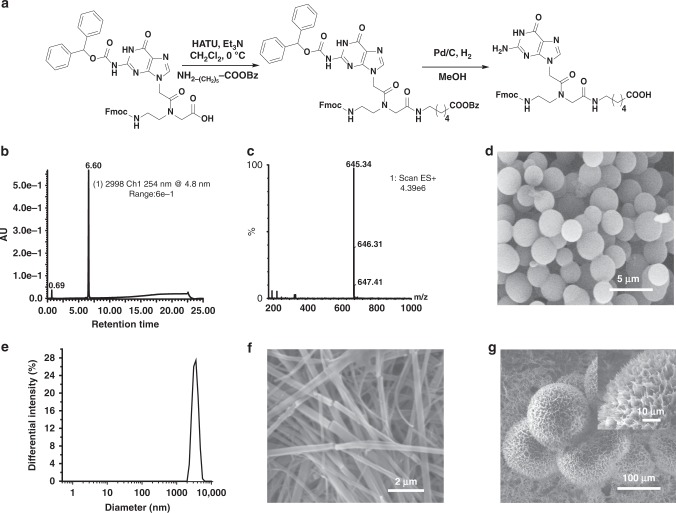
Fig. 1.
Synthesis of the Fmoc-G-PNA conjugate and self-assembly characterization. a Schematic representation of the synthetic procedure. b LC profile and c the corresponding mass spectrum. d SEM image of the microspheres. e DLS analysis of the spheres. The highest differential intensity was observed for a diameter of 3.39 μm. f SEM image of the elongated nanoribbons. g SEM image of the microparticles formed in a hot aqueous solution

