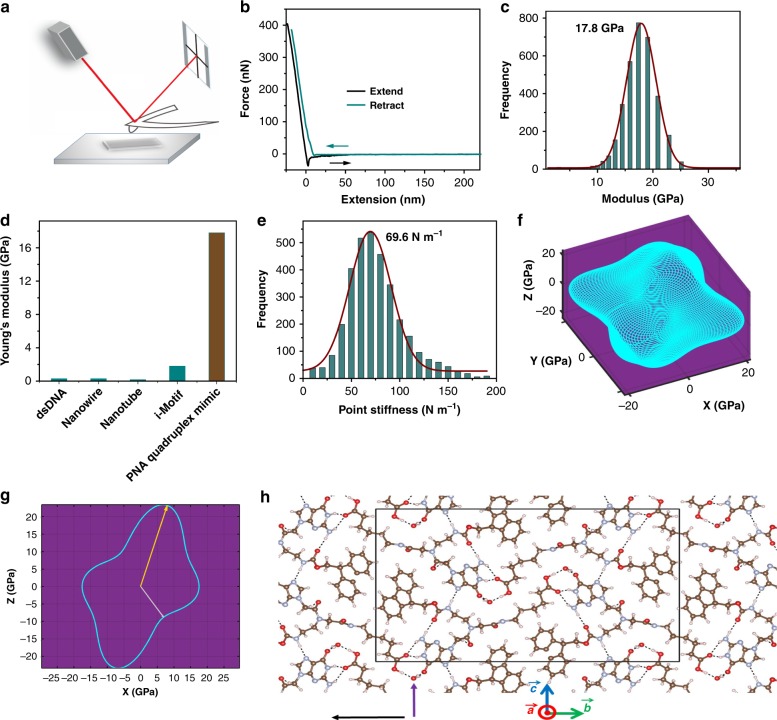
Fig. 5.
Mechanical properties of the Fmoc-G-PNA tetramer. a Schematic illustration of the atomic force microscopy experiments. b Typical force–distance traces. The black line corresponds to fitting of the contact region in the “extend” trace using the Hertz model. c Statistical distribution of the obtained Young’s modulus. The red line corresponds to the fitting using a Gaussian model. d Comparison of Young’s moduli previously reported for various DNA nanostructures and the observed tetramer assemblies in this work. dsDNA from refs. 9–11; Nanowire from refs. 12; Nanotube from refs. 13,16,17; i-Motif from ref. 14. e Statistical distribution of point stiffness measurements. The red line corresponds to the fitting using a Gaussian model. f 3D rendering of computed Young’s moduli. The 3D surface is constructed by setting the distance from the origin to each point on the surface to the value of Young’s modulus in the direction of the vector pointing from the origin to that point. The axes are given in GPa and negative signs are for directional indication only. In this plot, the lattice vector is on x, is on y, and is in the x−z plane. g 2D rendering of computed Young’s moduli in the x−z plane, using the same lattice vectors alignments as in f. Yellow and gray arrows indicate maximum and minimum values, respectively, in this plane. h Structure of the crystal. Purple and black arrows indicate the projection directions for minimal and maximal Young’s moduli, respectively, and the projections are in the y–z plane. The black frame denotes the projection of a single unit cell in the y–z plane

