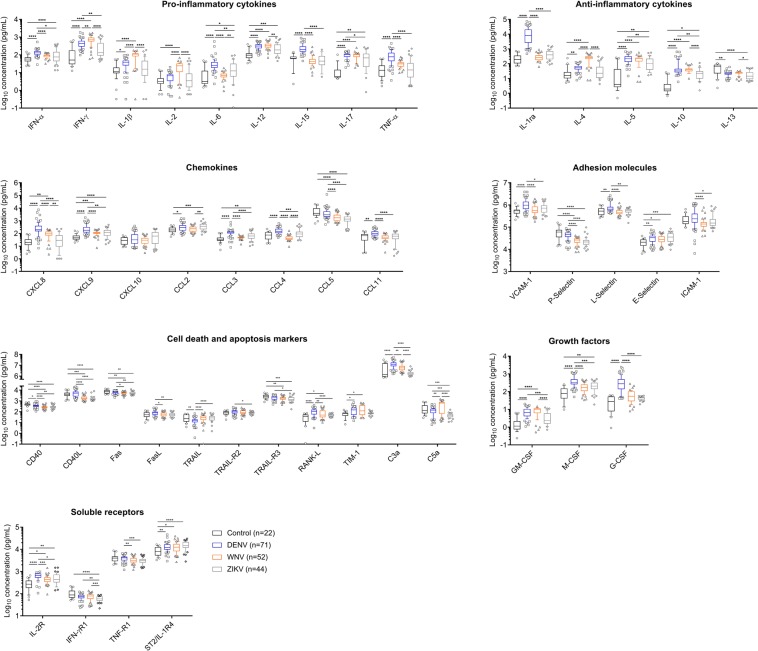
Figure 1.
Levels of soluble markers in plasma samples from NI blood donors (Control) (black) and from DENV (blue)-, WNV (orange)- and ZIKV (gray)-infected blood donors. Data are displayed in Log10 scale as median with interquartile range of plasma concentration (pg/mL) for each marker. Boxes, median values and interquartile range; whiskers, 10–90 percentile; Points below and above the whiskers are drawn as individual points. Statistical significance was considered at p < 0.05 and is represented by lines and with * for P < 0.05, ** for P < 0.01, and *** for P < 0.001, **** for P < 0.0001.

