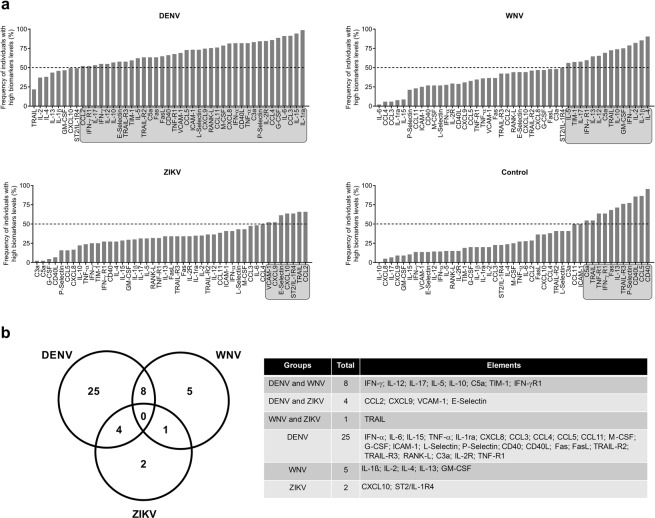
Figure 3.
Overall marker signature of soluble markers in plasma samples from DENV-, WNV- or ZIKV-infected blood donors and NI blood donors. (a) The marker signatures were assembled as an ascendant curve showing the frequency of individuals with plasma marker levels above the global median for each group. Markers with expression greater than the global median in more than 50% of the individuals are highlighted in gray. (b) A Venn diagram was built to characterize the overall frequency pattern of highly-expressed markers in each group. Venn diagram table lists the selected markers that were highly induced in each group.

