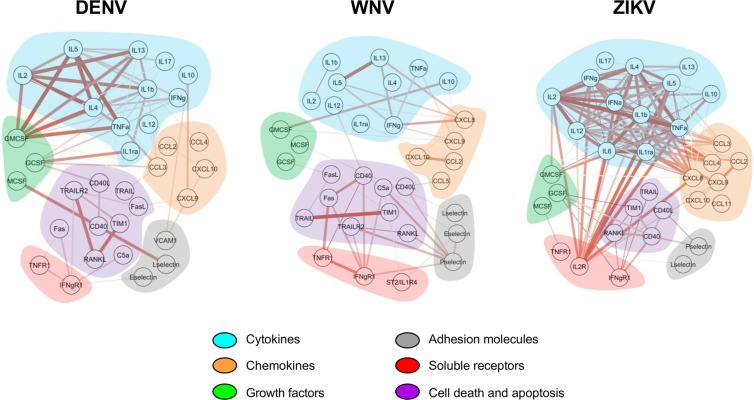
Figure 4.
Immune marker networks assembled using Cytoscape software based on Spearman’s correlation matrices and marker functions. Nodes represent the immune marker, and the connection edges represent significant correlation (Spearman >0.5; p-value < 0.05). Thicker lines with darker colors indicate higher absolute correlation values. Shaded areas are colored based on marker functions (Blue: cytokines; orange: chemokines; purple: cell death and apoptosis- related molecules; gray: adhesion molecules; green: growth factors; and red: soluble receptors).

