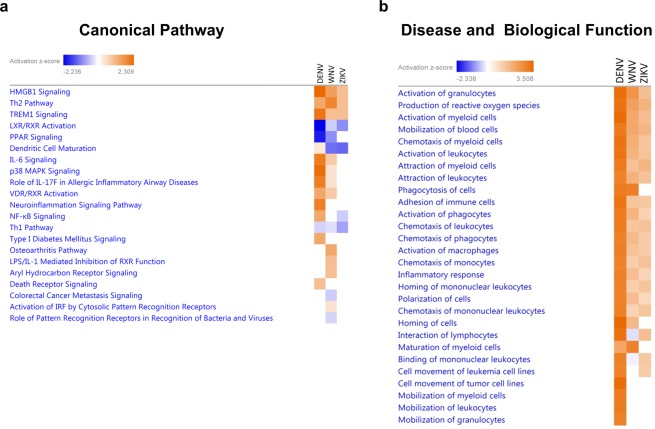
Figure 6.
Ingenuity Pathway Analysis predictions in the comparison analysis among DENV-, WNV- and ZIKV-infected donors. Predicted enriched canonical pathways (a) and diseases and biological functions (b) heatmap analyses were performed using IPA software. The z-score predicts whether a canonical pathway or diseases and biological functions are increased (positive z-score, orange) or decreased (negative z-score, blue) in accordance with the experimental dataset. Darker colors indicate higher absolute z-scores.

