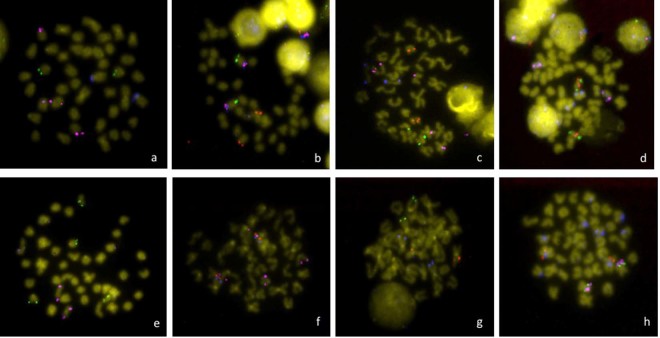
Figure 1.
Metaphase plates with the locations of the BACs used in this study: (a) 36-E3 (blue), 31-A1 (green), 31-N1 (pink); (b) 36H3 (pink), 36-J2 (blue), 46-C5 (red), 12-N5 (green); (c) 4F-12 (green), 4-E10 (red), 36-K1 (pink), 31-N1 (blue); (d) 13-F2 (red), 35-D17 (green), 31-N1 (pink), 31-A2 (blue); (e) 36-E3 (green), 31A1 (blue), 31-N1 (pink); (f) 13-G1 (green), 36-H2 (red), 36-M2 (pink), 36-J2 (blue); (g) 31A2 (green), 36-I3 (red), 36-H3 (blue); (h) 52-C17 (red), 48-K7 (blue), 36-I3 (green), 46-C5 (pink). Underlined BAC clones indicate the probes localized in this study. Other clones were used to map the relative position of all of the sequences to build the integrative map.

