
Figure 4.
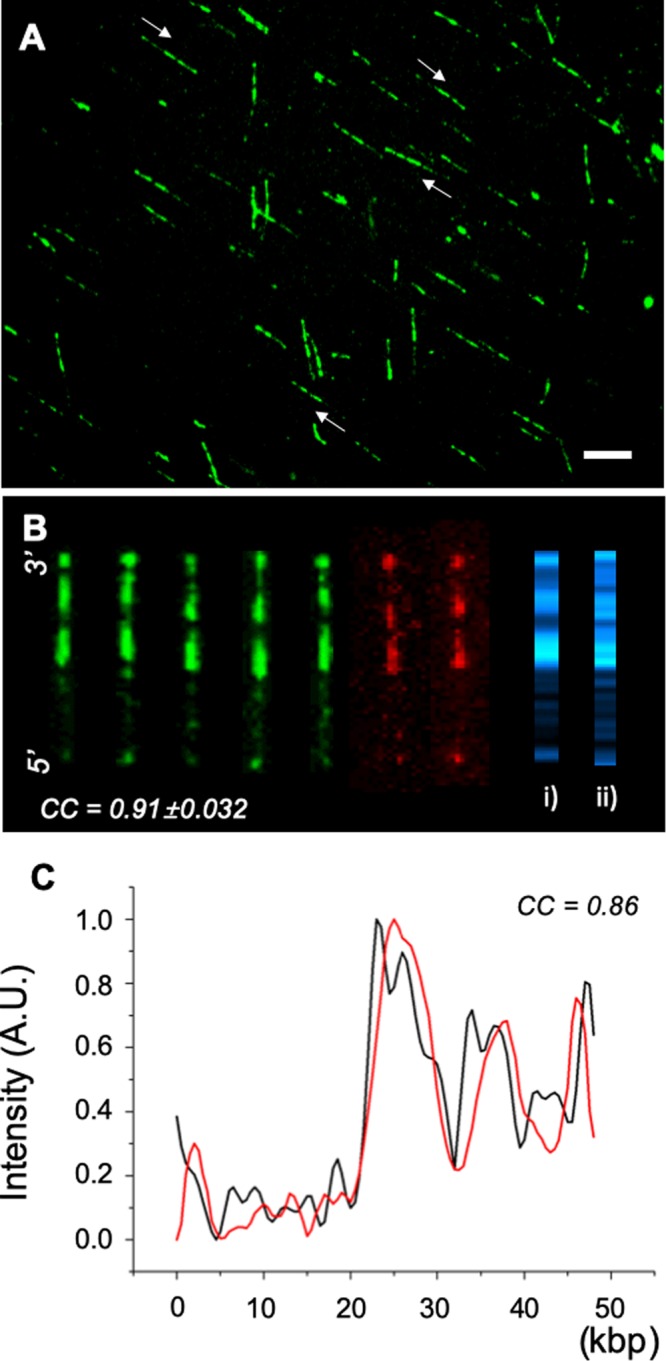
tTALE-FP stained λ DNA molecules immobilized on a positively charged surface in 70 mM NaCl. (A) Fluorescence micrographs of surface-immobilized AT-specific patterned DNA molecules with stained by preincubation in 2 nM tTALE-FP without flushing unbound tTALE-FP. The white arrows indicate the molecular direction of λ DNA (scale bar = 10 μm). (B) Aligned λ DNA, eGFP (green) and mCherry (red). cc = 0.91 ± 0.032 among molecules. (i) Consensus map. (ii) AT-frequency in silico map. (C) Comparison of consensus map (red) and AT-frequency in silico map (black). cc = 0.86.