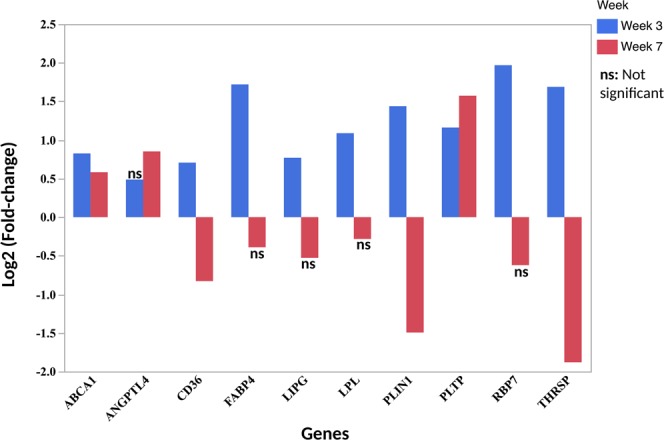
Figure 4.

Log2 Fold-change of differentially expressed genes in WB associated with lipid metabolism between affected and unaffected broiler chickens at week 3 and week 7 of age. Positive log2 Fold-change indicate upregulation in affected chickens while negative log2 Fold-change indicate down regulation in affected chickens. Notice that the majority of the genes are upregulated at week 3 and downregulated at week 7 of age. However, the expression of some genes were not statistically different between affected and unaffected chickens and are denoted as ns (not significant).
