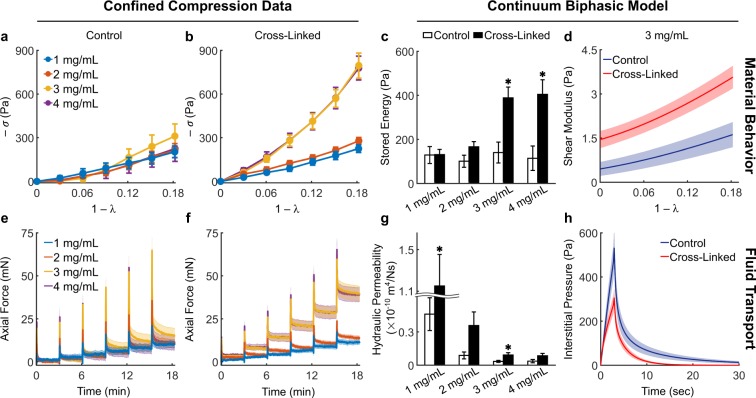
Figure 5.
Collagen network mechanics as a function of concentration and cross-linking. Confined compression data from 1 mg/mL (control: n = 5, cross-linked: n = 9), 2 mg/mL (control: n = 6, cross-linked: n = 9), 3 mg/mL (control: n = 8, cross-linked: n = 10), and 4 mg/mL (control: n = 5, cross-linked: n = 9) gels are quantified via numerical fitting to a continuum biphasic model (Supplementary Fig. 5) to infer material behavior (top row) and fluid transport properties (bottom row) of collagen networks. Equilibrium responses from control (a) and cross-linked (b) gels compressed to 18% of their original height by means of 3% steps show that only the latter display stiffer mechanical responses for increasing collagen concentration. Increased material stiffness due to cross-linking is reflected by the higher compressive energy (c) stored elastically within cross-linked networks at 18% deformation and calculated from Eq. (3) as −W. Note how the elastic energy storage does not change with concentration for control gels. The increase in energy storage is accompanied by an increasingly nonlinear material behavior, shown here for 3 mg/mL gels as a steeper change in shear modulus with increasing strain (d). Transient responses from control (e) and cross-linked (f) gels show that the temporal decay in force – primarily due to flow of interstitial fluid upon compression – is affected by both collagen concentration and cross-linking. The isotropic and strain-independent permeability (g) estimated from experimental data decreases consistently with increasing collagen concentration due to increasing frictional losses in denser matrices. More importantly, we found that controls displayed consistently lower permeabilities with respect to cross-linked gels, despite large variability due to experimental uncertainty. Estimation of the interstitial fluid pressure (h) developed by 3 mg/ml gels at the bottom of the confining chamber during the first step of compression shows a higher peak pressure and a slower pressure decay in control networks. Data are shown as mean ± SEM with numerical values and statistical analyses provided in Supplementary Table 2. * indicates statistically significant differences with respect to concentration-matched controls at p < 0.05.

