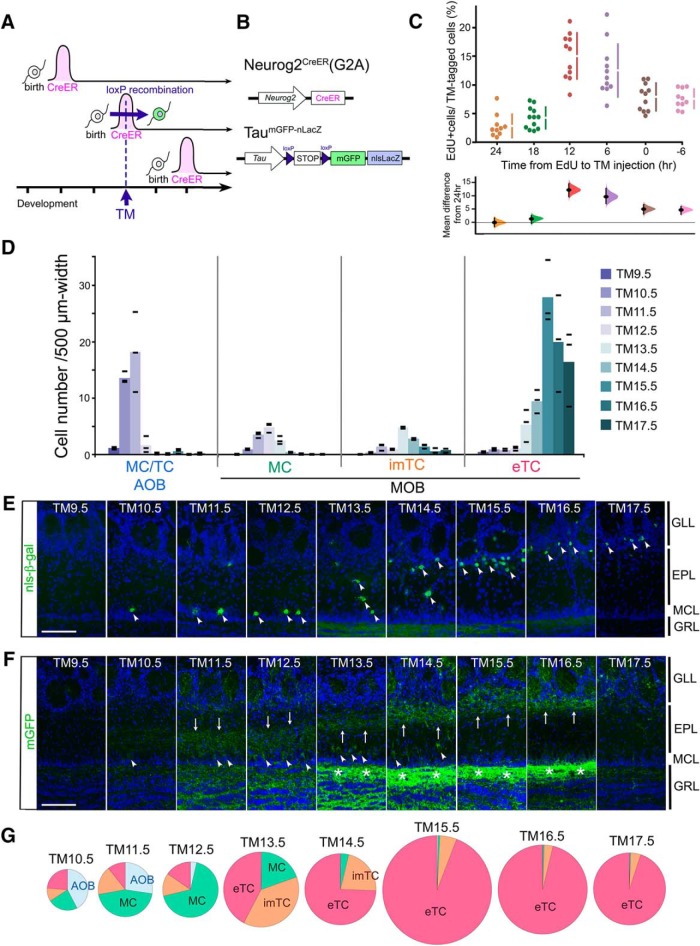
Figure 1.
Birthdate tagging of OB projection neurons. A, The experimental design of the birthdate tag method. The horizontal axis indicates the developmental time course. Individual neurons express CreER only transiently, soon after birth. An injection of TM at a certain developmental time point induces Cre-loxP recombination only in neurons expressing CreER. B, Schematized gene structures of the birthdate tag driver Neurog2CreER(G2A) and TaumGFP-nLacZ reporter used in this figure. C, Proportion of EdU-incorporated cells in birthdate-tagged neurons shown by Cumming estimation plot. TM was given at a fixed time point at E12.5, and EdU was given at the indicated time before the TM injection. The raw values calculated from individual mice and mean ± SD are plotted on the upper axis. On the lower axis, mean differences from the 24-h group are plotted as bootstrap sampling distributions. Each mean difference is depicted as a dot. Each 95% confidence interval is indicated by the ends of the vertical error bars. D, The number of birthdate-tagged neuron subtypes counted in OB sections prepared from P14 Neurog2CreER(G2A); TaumGFP-nLacZ mice that were given TM at different embryonic stages. The cell numbers are normalized by the layer distance used for cell counting. The color intensity coded columns show the means of tagged-cell numbers at individual TM injection stages. Black bars show the raw values obtained from individual mice (n = 3 for each TM stage). E, F, Immunostaining of MOB sections prepared from P14.5 Neurog2CreER(G2A); TaumGFP-nLacZ mice for nucleus-localized β-gal (E) and membrane-bound GFP (F) reporters. TM was administrated at different embryonic stages as indicated at the top. Arrowheads (E, F) indicate reporter-tagged cell bodies, and arrows (F) indicate the position of reporter-tagged dendrites in the EPL. Asterisks (F) show the reporter-labeled internal plexiform layer that contains intrabulbar association fibers. Scale bar = 100 μm. GRL: granule cell layer. G, Proportion of the neuron subtypes birthdate tagged at different TM stages in the whole OB. The proportions were calculated without normalization by the tissue size, and therefore AOB neurons may look underrepresented compared with D, reflecting the small size of AOB. The diameter of each pie chart is proportional to the number of neurons. The exact numbers of neurons counted are shown in Extended Data Figure 1-1.

