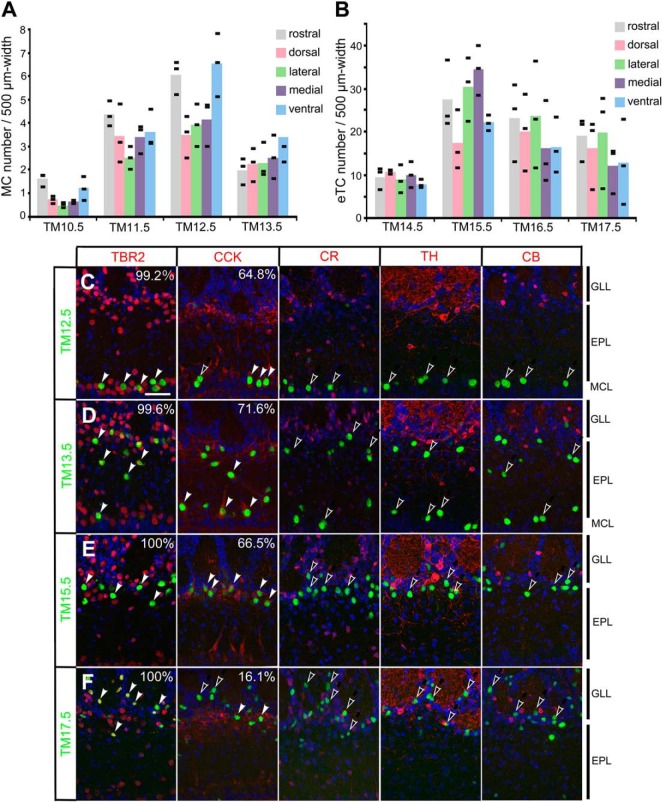
Figure 2.
Characterization of birthdate-tagged neurons in the MOB. A, B, Distribution of birthdate-tagged MCs (A) and eTCs (B) in different OB sectors. The numbers of MCs and eTCs are counted from the rostral, dorsal, lateral, medial and ventral sectors of MOBs prepared from P14 Neurog2CreER(G2A); TaumGFP-nLacZ mice that were given TM injection at the embryonic stages indicated at the bottom. Black bars indicate the raw values obtained from individual mice (n = 3 for each category), and colored columns represent the means. C–F, Expression of neuron subtype markers in β-gal reporter-labeled (green) neurons that were tagged at TM12.5 (C), TM13.5 (D), TM15.5 (E), and TM17.5 (F) in P14.5 Neurog2CreER(G2A); TaumGFP-nLacZ MOBs. Red staining shows TBR2 (projection neuron marker), cholecystokinin (projection neuron marker), calretinin (periglomerular cell marker), tyrosine hydroxylase (interneuron marker) and calbindin (periglomerular cell marker) from left to right. DAPI (blue) staining is superimposed in all panels. The filled white arrowheads indicate marker-positive birthdate-tagged neurons, and the open arrowheads indicate marker-negative birthdate-tagged neurons. The percentage of marker-positive in β-gal-positive neurons is shown on the right top corner in each panel. The percentage is not shown when no marker-positive cells were found in β-gal-positive birthdate-tagged neurons. The positions of MOB layers are indicated on the right-hand end. Scale bar = 50 μm.

