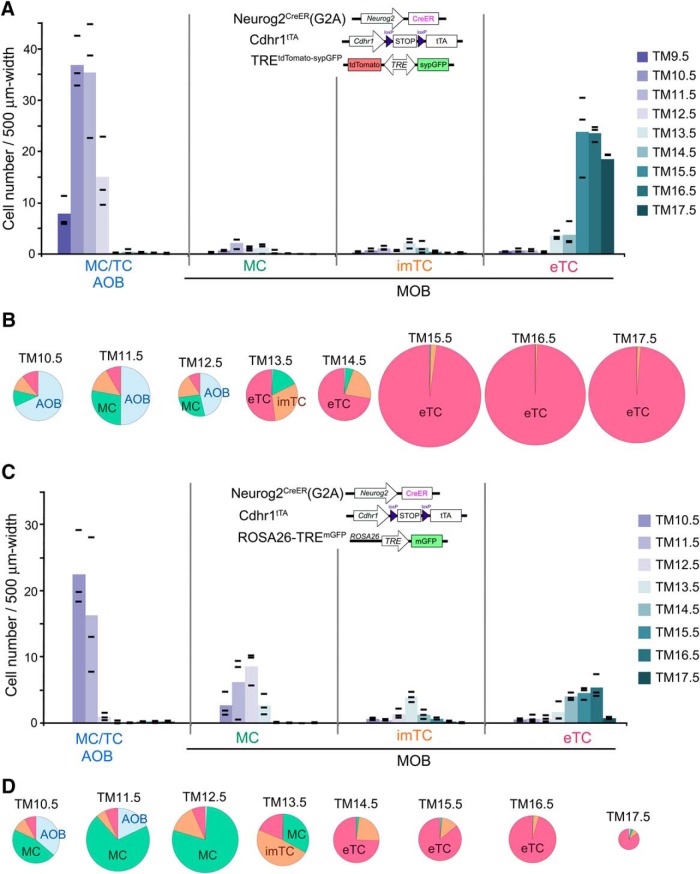
Figure 3.
Birthdate tagging of OB projection neurons using OB-specific reporters. The birthdate-tagged projection neuron subtypes were counted in OB sections prepared from P14 Neurog2CreER(G2A); Cdhr1tTA; TREtdTomato-sypGFP (A, B) and P14–P15 Neurog2CreER(G2A); Cdhr1tTA; ROSA26-TREmGFP (C, D) mice that had been given TM injection at different embryonic stages. A, C, The color intensity coded columns show the means of tagged cell numbers at individual TM injection stages. Black bars depict the raw values obtained from individual mice (n = 3 for each TM stage). The cell numbers are normalized by the layer distance used for cell counting. B, D, Proportion of neuron subtypes birthdate tagged at different TM stages in the whole OB. The proportions were calculated without normalization by the tissue size, and therefore may look slightly different from the quantifications in A, C. The diameter of each pie chart reflects the number of neurons. The exact numbers of neurons counted are shown in Extended Data Figure 3-1.

