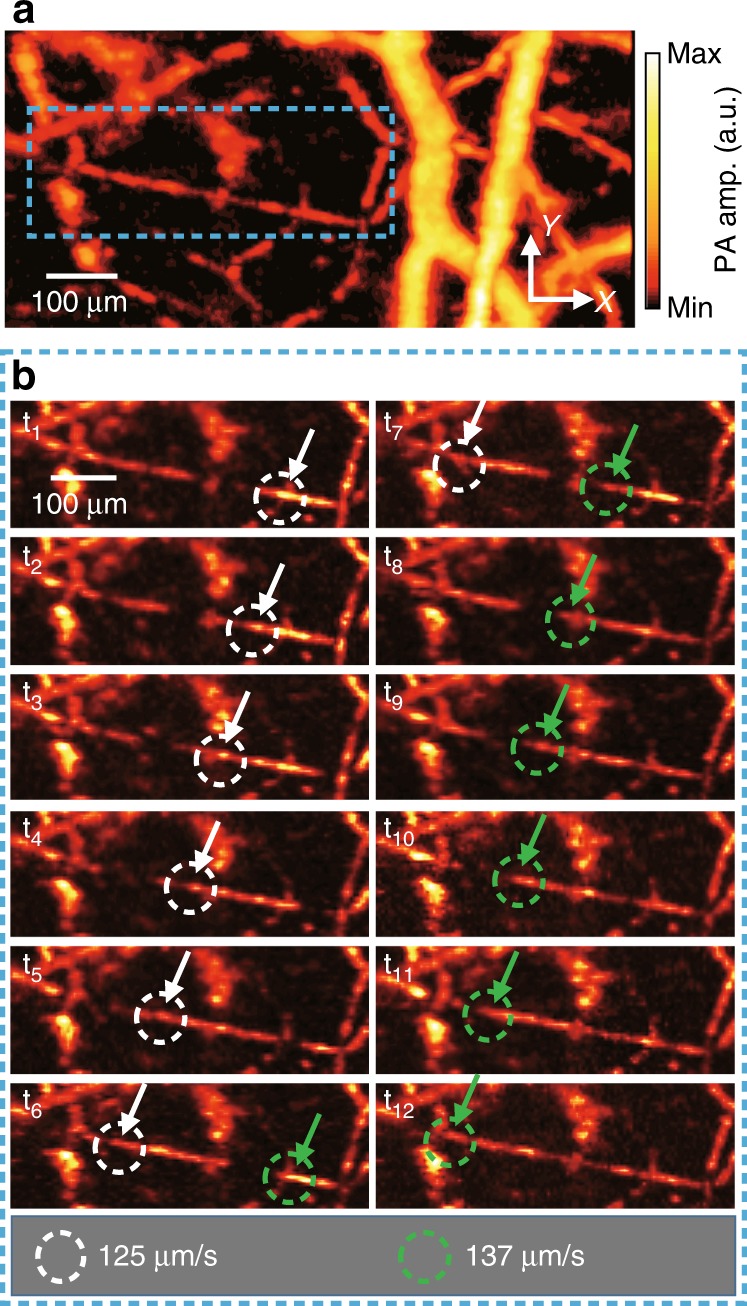
Fig. 4. Photoacoustic (PA) monitoring of hemodynamics in a mouse ear.

a Representative single-shot PA MAP image of the mouse ear. b Series of PA images over a time period showing the flow of RBCs (also see Supplementary Movie 4). Close-up views of the region are outlined by the blue dashed boxes in a. Flowing red blood cells are highlighted by the white and green dashed circles. The flow rates of the RBCs during the captured period are quantified as shown below. MAP, maximum amplitude projection.
