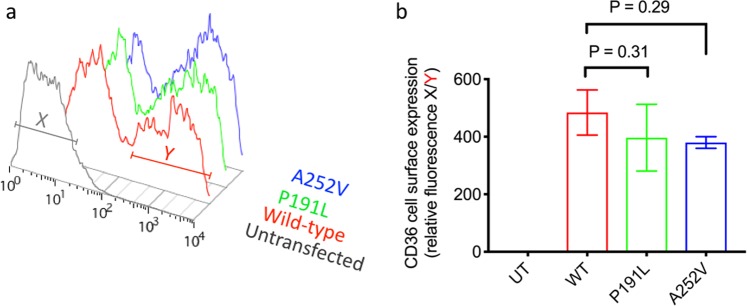
Figure 3.
Measurement of variant CD36 expression at the cell surface by flow cytometry. Cells were transfected with wild type CD36 (WT) or variant CD36 constructs, as indicated and labelled with saturating concentrations of primary (mAb1258) and secondary (rabbit anti-mouse RPE) antibodies. R-Phycoerythrin fluorescence was detected for 10,000 cells of normal size and granularity by flow cytometry. A histogram of the red fluorescence raw data for one representative experiment is shown in (a). The data were quantified by gating on the population that expresses maximal CD36 for wild-type and each variant (red bar ‘Y’). The median level of fluorescence was then normalized against the median level of fluorescence of untransfected cells (grey bar ‘X’) to give a relative fluorescence intensity which can be compared across replicate data sets to produce the bar chart in (b). Data points represent the mean of three biological replicates and error bars describe standard error of the mean. The surface expression of CD36-p.Pro191Leu and CD36-p.Ala252Val was not statistically different to wild-type CD36 (ANOVA with Holm-Sidak’s multiple comparison test.

