Figure 1.
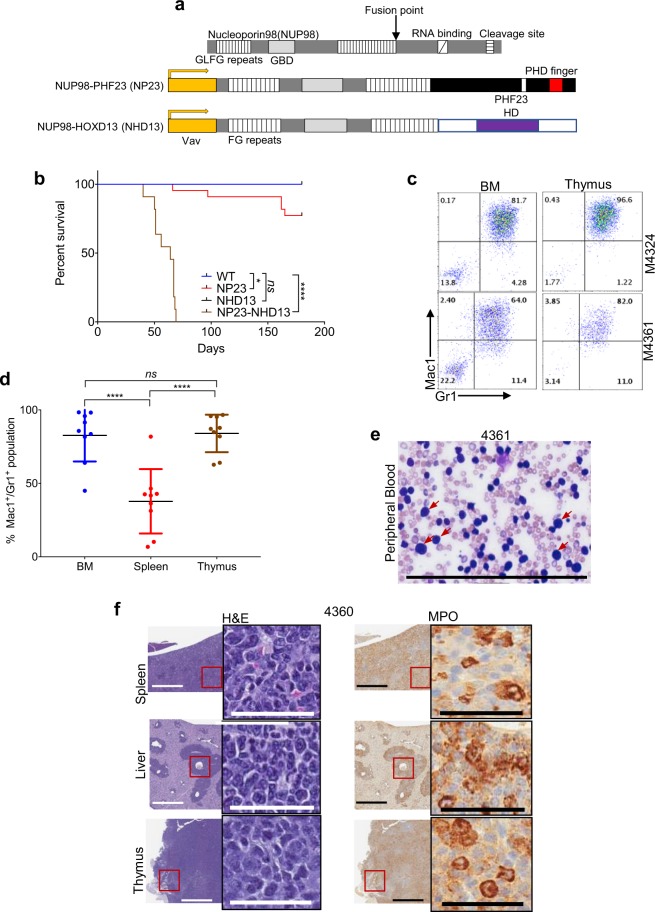
NP23-NHD13 mice develop aggressive AML. (a) Structure of NUP98 (top), NUP98-PHF23 fusion transgene (middle), and NUP98-HOXD13 fusion transgene (bottom). Protein fusion points are indicated by arrow; Vav regulatory elements are indicated in yellow. (b) Survival of NP23-NHD13(n = 11), NP23(n = 22), NHD13(n = 9) and WT(n = 17) mice. WT and NHD13 curves are superimposed at 100% survival each. Data analyzed by Log-rank (Mantel-Cox) test, ****P < 0.0001 (WT vs NP23-NHD13). (c) Thymus is more heavily invaded with Mac1+/Gr1 + leukemic cells than BM in several samples. (d) Tissue invasion of myeloid cells. Data are expressed as means ± SD, n = 9 mice. (e) Sheets of myeloblasts in peripheral blood smear; several examples indicated with red arrows. (f) H&E staining of leukemic cell invasion in parenchymal organs (spleen, liver and thymus); myeloperoxidase (MPO) staining of infiltrate. ns = not significant, *P < 0.05, ****P < 0.0001, by one-way ANOVA with a correction provided by the Tukey’s multiple comparisons test. Scale bars = 200 μm for blasts count, 800 μm (low power view), 50 μm (high power view).

