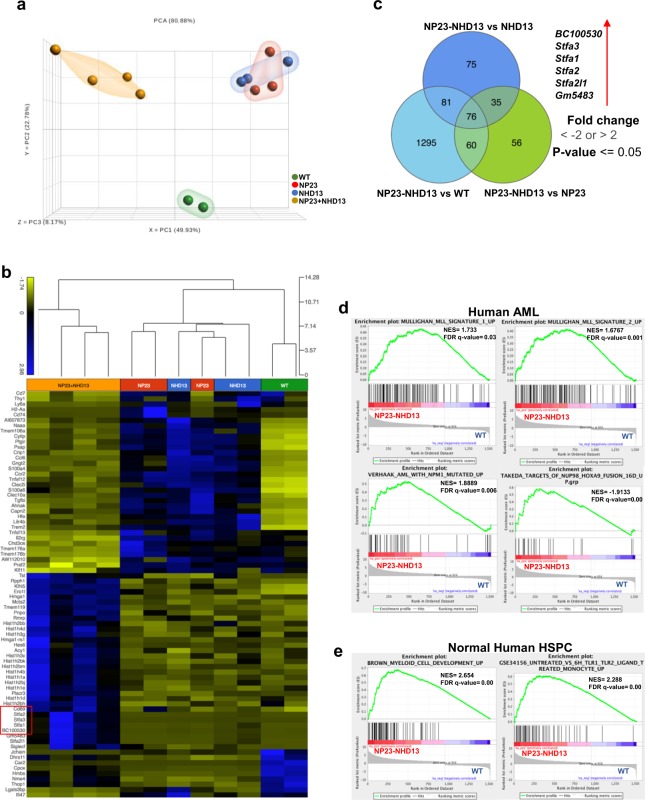
Figure 3.
NP23-NHD13 AML gene expression profile is distinct from single transgenic NP23 and NHD13 AML. (a) PCA plot derived from NP23, NHD13 and NP23-NHD13 AML (all BM samples) compared to WT Lin− BM. (b) Hierarchical clustering shows NP23-NHD13 leukemia samples cluster distinct from WT, NP23 and NHD13 leukemia samples. (c) Venn diagram indicates 76 genes differentially expressed in NP23-NHD13 AML. (d) GSEA comparison of genes differentially (defined as 2-fold expression change, p < 0.05) expressed between NP23-NHD13 AML and WT LN BM demonstrates that gene sets upregulated in NP23-NHD13 AML are also enriched in specific human AML gene sets, (e) Enrichment of genes overexpressed in NP23-NHD13 AML correlate with genes enriched in normal human myeloid development.

