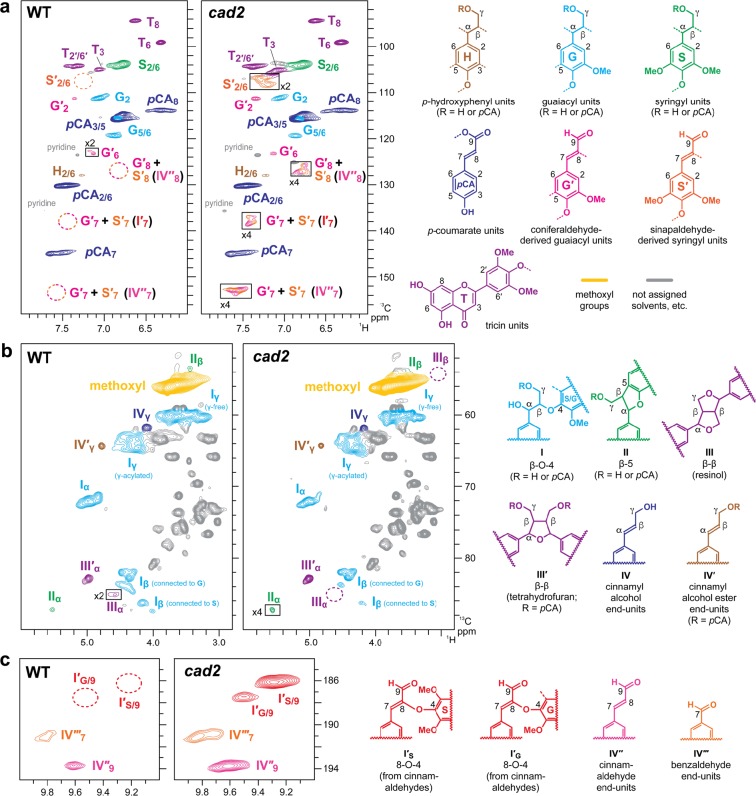
Figure 3.
Solution-state two-dimensional short range 1H–13C correlation (HSQC) NMR analysis of dioxane-soluble lignin samples prepared from mature culm tissues of wild-type (WT) and cad2 mutant rice plants. (a) Aromatic sub-regions showing signals from major lignin aromatic units. (b) Oxygenated aliphatic sub-regions showing signals from major lignin side-chain units. (c) Aldehyde sub-regions showing signals from aldehyde units. Contours are color-coded to match the displayed structures. Boxes labelled ×2 and ×4 represent regions with scale vertically enlarged by 2- and 4-folds, respectively. Volume integration data are listed in Table 1. For signal assignments, see Tables S3 and S4 in Supplementary Information.

