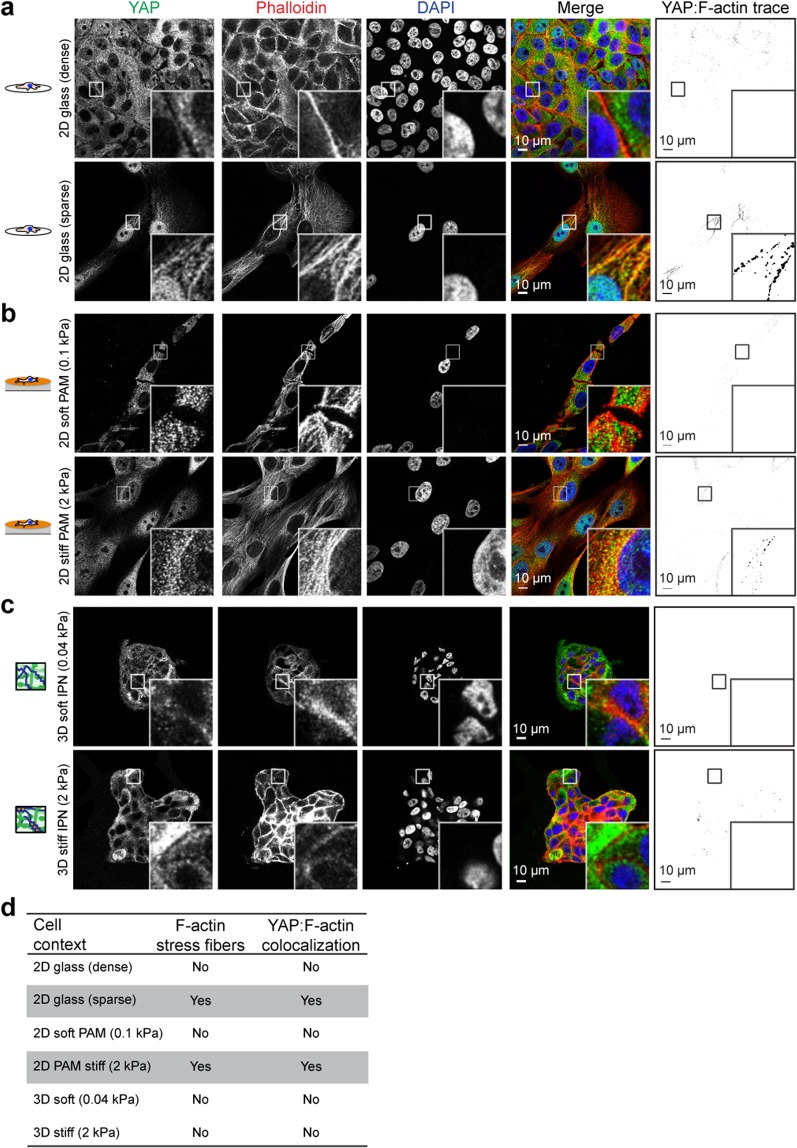
Figure 2.
YAP associates with F-actin under activating conditions. MCF10A cells densely or sparsely plated on (a) 2D glass coverslips or (b) 2D col-1 coated PAM gels, YAP:F-actin analysis in last column indicates overlapping regions of ≥60% YAP pixel intensity and ≥60% F-actin pixel intensity. YAP (green), F-actin stained with phalloidin (red), DNA stained with DAPI (blue). Bar: 10 µm. (c) MCF10A cells encapsulated for seven days in soft and stiff IPNs and stained as above. Bar: 10 µm. (d) Table of YAP activation in relation to dimensionality and stress fiber formation. Grey boxes indicate conditions that activate YAP.

