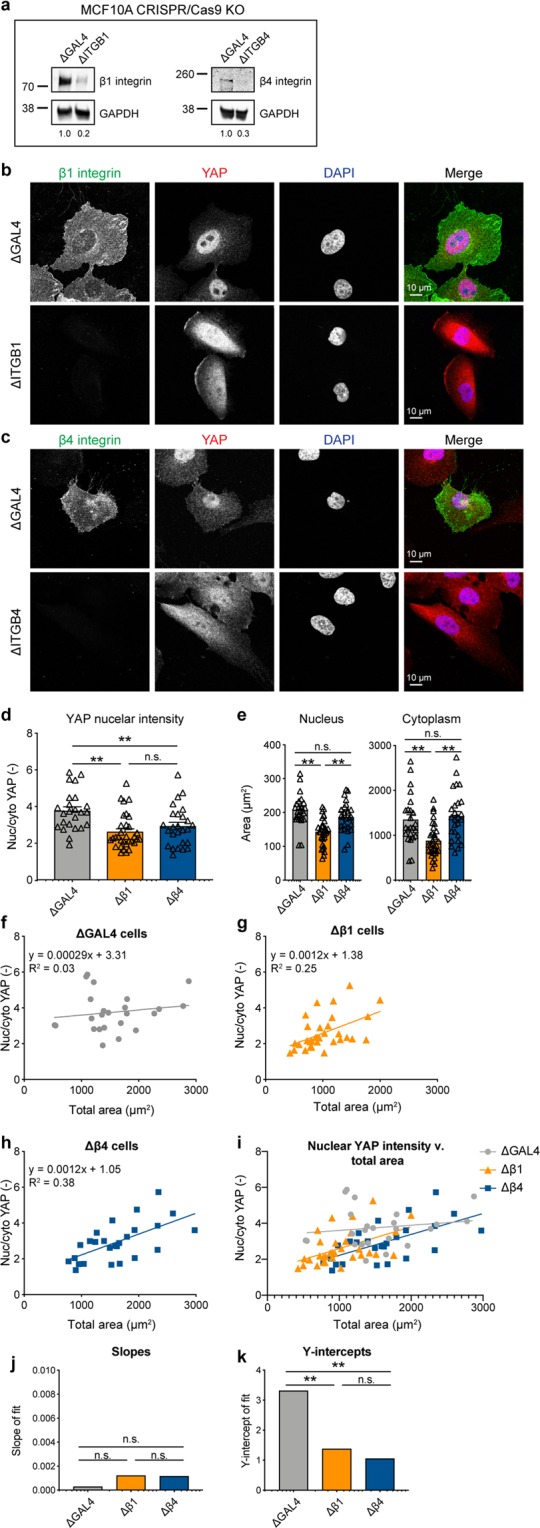
Figure 4.

β1 and β4 integrin KO decrease YAP nuclear localization. (a) Western blot analysis of MCF10A ΔITGB1 and ΔITGB4 cells compared to control ΔGAL4 cells. GAPDH was used as a loading control. Quantification of bands (β1 or β4 integrin/GAPDH) below each lane. Images cropped from the same blot using different fluorescent intensities. Full-length blot included in Supplementary Fig. 2. (b) ΔITGB1 cells stained for β1 integrin (green) and YAP (red), DNA stained with DAPI (blue). (c) ΔITGB4 cells stained for β4 integrin (green) and YAP (red), DNA stained with DAPI (blue). (d) YAP nuclear localization in KO cells, **p < 0.01. (e) Nuclear and cytoplasmic areas of KO cells, **p < 0.002. Bars represent mean ± SEM, symbols represent each cell, p-values from one-way ANOVA followed by Tukey post-hoc comparison tests. (f) ΔGAL4 YAP nuclear localization with area. (g) ΔITGB1 YAP nuclear localization with area. (h) ΔITGB4 YAP nuclear localization with area. N = 24–32 cells from 3 independent experiments. (i) Comparison of fits for YAP nuclear localization with area in KO cells. Comparison of (j) Slopes and (k) y-intercepts from best fit lines of YAP nuclear localization with area in KO cells from (f–h). **p < 0.01. p-values from linear regression comparing 3 KO best fit lines.
