Fig. 3.
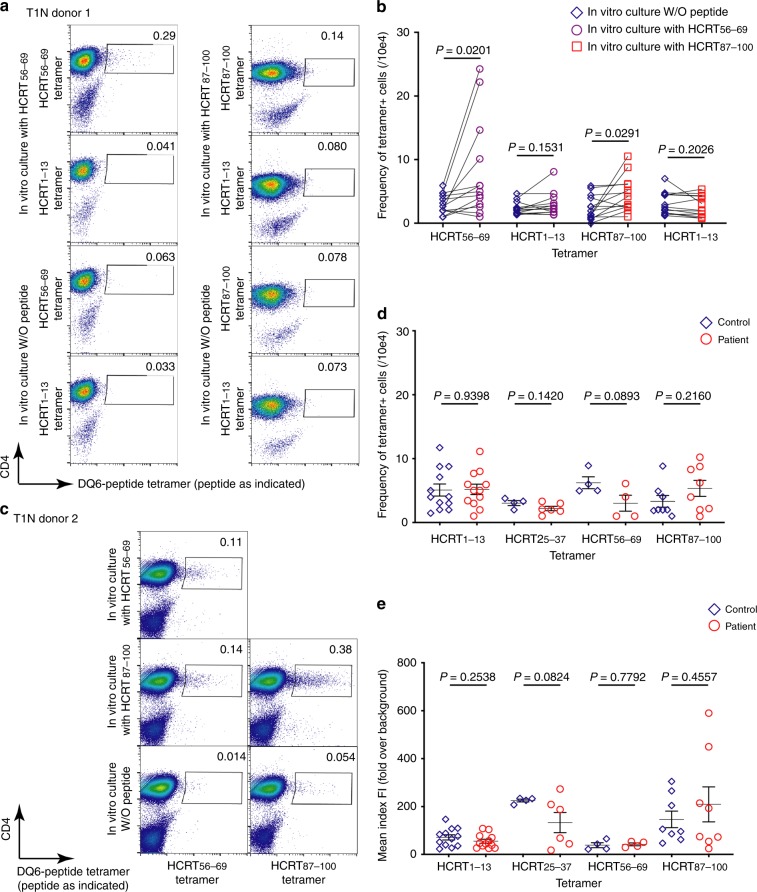
Tetramer+/CD4+ T cells in DQ6+ donors. a Dot-plots of CD4+ T cells stimulated in vitro with the indicated peptides followed by staining with the indicated tetramers. Frequencies (%) of tetramer+/CD4+ T cells are indicated. b Comparison between frequencies of tetramer+ T cells from the same T1N donor (paired as indicated) with and without peptide stimulation. Significance (P < 0.05, bolded) is determined using the paired samples t-test (n = 13 donors). c Enrichment (with peptide stimulation vs. without) of DQ6-HCRT56–69 tetramer+/CD4+ T cells in HCRT87–100 peptide stimulated culture. d Frequencies or e tetramer-binding ranks (mean index fluorescence intensity) of tetramer+ T cells from patients and controls (sample information summarized in Table 1) stained with the indicated tetramers. Statistical analysis compares control and patient samples within each tetramer specificity. Significance (P < 0.05, bolded) is determined using the unequal variance t-test. The error bar represents mean ± SEM

