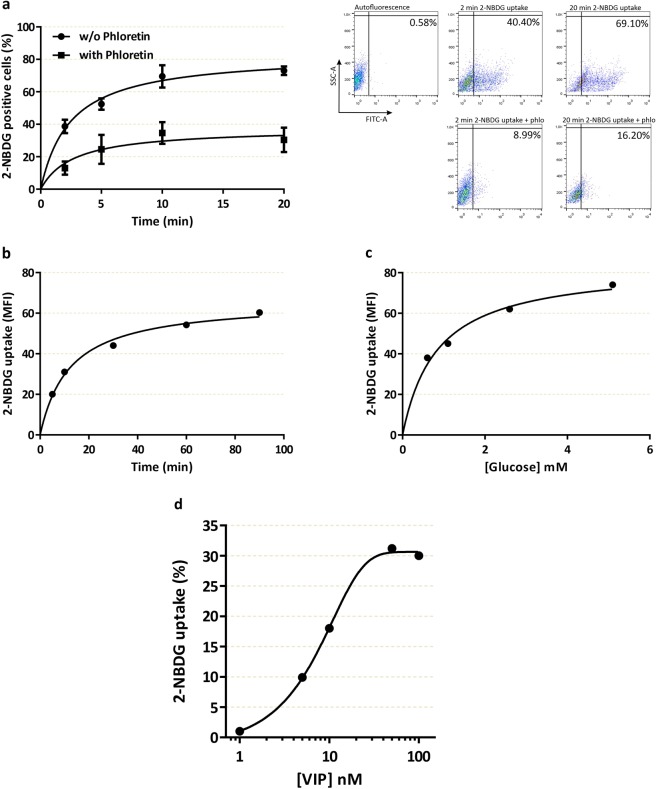
Figure 1.
Characterization of 2-NBDG uptake and the effect of VIP in trophoblast cells. Swan 71 cell line was grown until subconfluence, then the cells were washed with cold PBS and medium was replaced by glucose free medium. 2-NBDG was added for different times (a,b) or 10 min (c,d), cells were washed with cold PBS and flow cytometry was performed. Results in (b–d) are express as the difference between without/with 1 mM Phloretin. (a) 2-NBDG positive cells at 2, 5, 10 and 20 min in absence/presence of 1 mM Phloretin. Dot plots are representative of autofluorescence control and 2 and 20 min of 2-NBDG incubation in absence/presence of 1 mM Phloretin. Each point represents the Mean ± S.E.M. (b) Mean fluorescence intensity (MFI) after incubation with 2-NBDG for 5, 10, 30, 60, and 90 min. The points are representative of 3 different experiments. (c) MFI after 10 min incubation with 2-NBDG in glucose free medium supplemented with 0.5, 1, 2.5, 5 mM of glucose. The points are representative of 3 different experiments. (d) 2-NBDG uptake by trophoblast cells incubated with 1–100 nM VIP expressed as percent vs. basal value taken as 1. VIP was added 10 min before the addition of 2-NBDG for another 10 min.

