Figure 6.
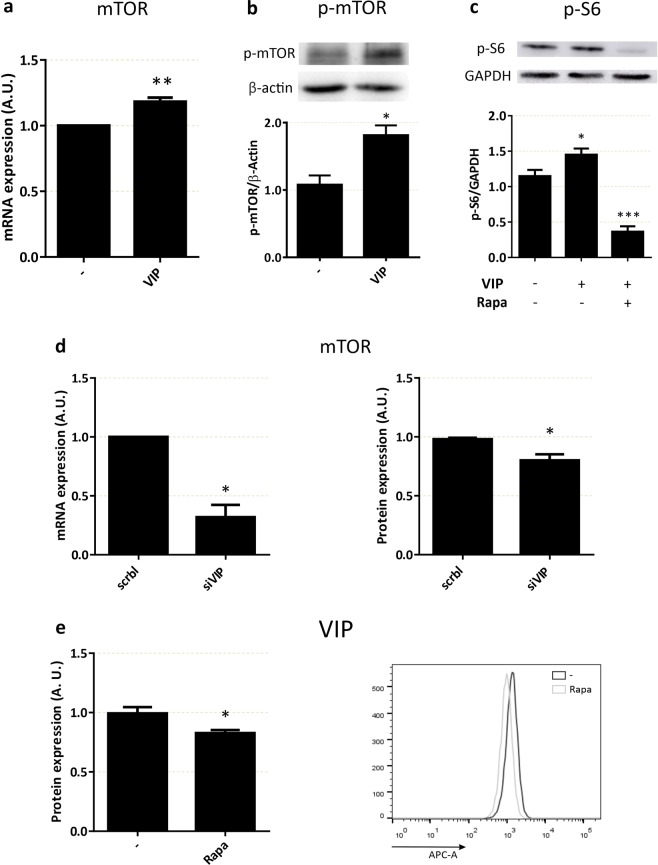
Cross-regulation of mTOR and VIP in trophoblast cells. (a) mTOR mRNA expression. Swan 71 cells were seeded and treated as in Fig. 3, in absence/presence of 50 nM VIP (n = 6), qRT-PCR was performed and results were analysed employing 2−ΔΔCT method normalized to the endogenous GAPDH gene control. (b) mTOR phosphorylation. Cells were incubated in absence/presence of 50 nM VIP for 20 min, Western Blot was performed and p-mTOR was normalized to β-Actin. The image shows cropped lines corresponding to p-mTOR and β-Actin. Blots were run under the same experimental conditions (n = 4). (c) S6 phosphorylation. Cells were incubated in absence/presence of 50 nM VIP for 20 min. 100 µM rapamycin were added 20 min before the stimulus, Western Blot was performed and p-S6 was normalized to GAPDH. The image shows cropped lines corresponding to p-S6 and GAPDH. Blots were run under the same experimental conditions (n = 3). Full-length gels are presented in Supplementary Fig. S1. (d) mTOR expression in VIP-silenced cells. Swan 71 cells were seeded, VIP was knocked-down for 72 h and treated as in (a) for mRNA expression, or flow cytometry was performed for protein expression (n = 3). (e) VIP expression. Cells were cultured as in Fig. 3, then 100 µM of rapamycin was added for 24 h. Protein secretion was inhibited by Stop Golgi® incubation for 4 h and cells were subjected to VIP immunostaining and quantification by flow cytometry (n = 3). ANOVA with Dunnett’s multiple comparisons against basal condition or Student’s t test was used to compare between conditions. Results are expressed as Mean ± S.E.M. *p < 0.05, **p < 0.01, *** p < 0.001.

