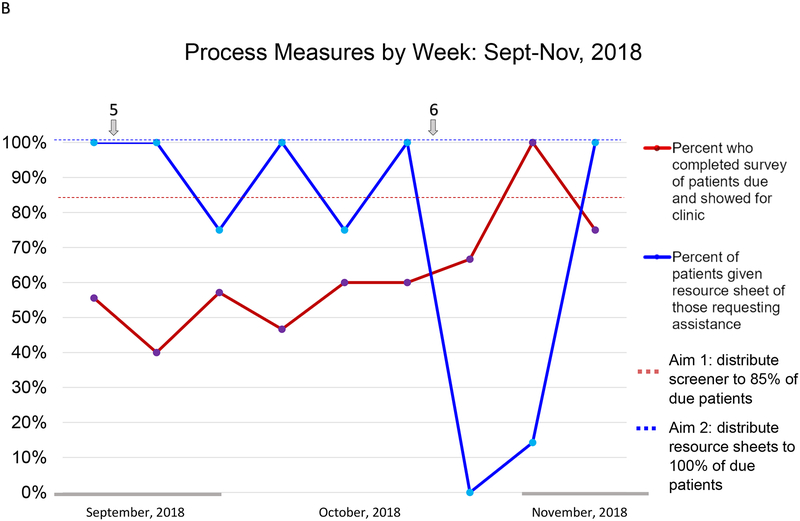
FIGURE 1B:
Run chart of process measures by week. An analysis of process measure by week shows more detailed trends for this time period. 5. All patients with SCD presenting for a non-sick or non-urgent clinic appointment were given screeners. This did not result in significant change in the numbers of screeners that were completed or documented. 6. Clinical assistants entered screener results into EMR at increasing rates, but were not explicitly asked to page social work for positive results to not overburden the clinical assistants. This resulted in decreased distribution of resource sheets. Changes were made to the clinic flow to ask clinical assistants to page SW for positive results. Reminders were posted in exam rooms and a new clinic flow diagram was distributed. Physicians were reminded to continue reviewing the screening results.

