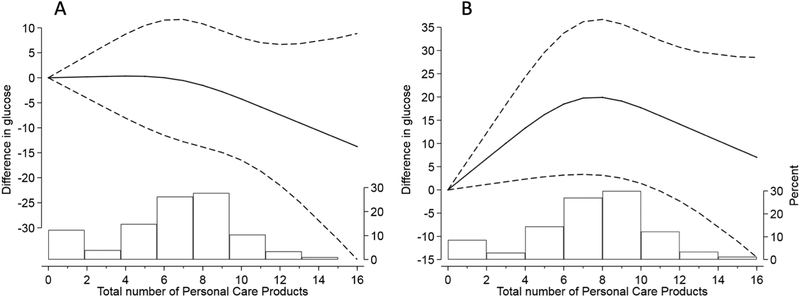
Figure 1.
Differences in mean glucose levels at increased total number of products used at the first (A) and second trimester (B). Exposure modeled as continuous with restricted cubic splines. Adjusted for maternal age, smoking, race, education, infertility diagnosis, n of fetuses. The histogram represents the PCP distribution in the population.

