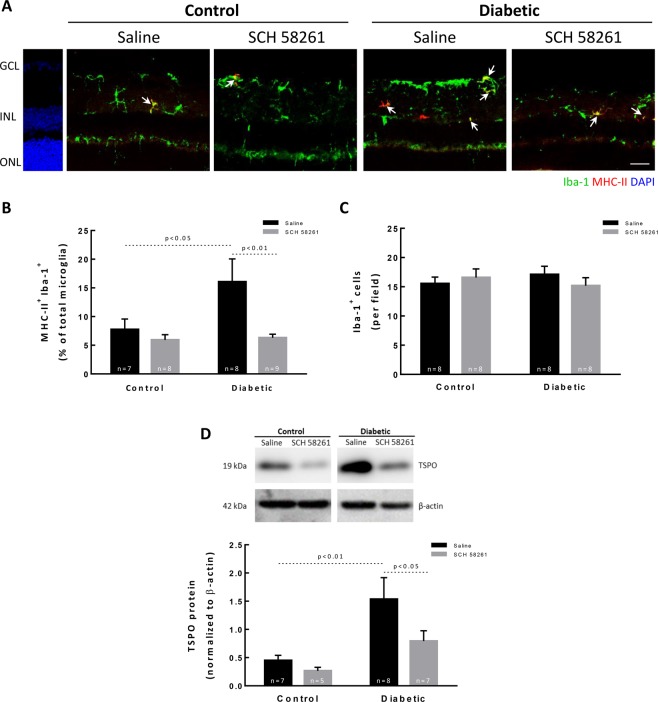
Figure 2.
Treatment with A2AR antagonist decreases microglia reactivity in the retina of diabetic mice. (A) Retinal sections were stained with antibodies against Iba-1 (green) and MHC-II (red). Nuclei were stained with DAPI (blue). Representative images are depicted and arrows indicate some MHC-II+ Iba-1+ cells found in each condition. (B) Activated microglia (MHC-II+ Iba-1+ cells) were counted and normalized to the percentage of total microglial cells (Iba-1+ cells) from 7–9 animals. (C) The number of microglia per retinal section was counted. (D) TSPO protein levels were assessed by Western blot and the results are expressed as a ratio to β-actin from 6–9 independent experiments. Representative Western blots are presented. Full length uncropped images are presented as Supplementary Fig. 1. One-way ANOVA test, followed by Holm-Šídák multiple comparison test. GCL: ganglion cell layer; INL: inner nuclear layer; ONL: outer nuclear layer. Scale bar: 100 µm.

