Figure 8.
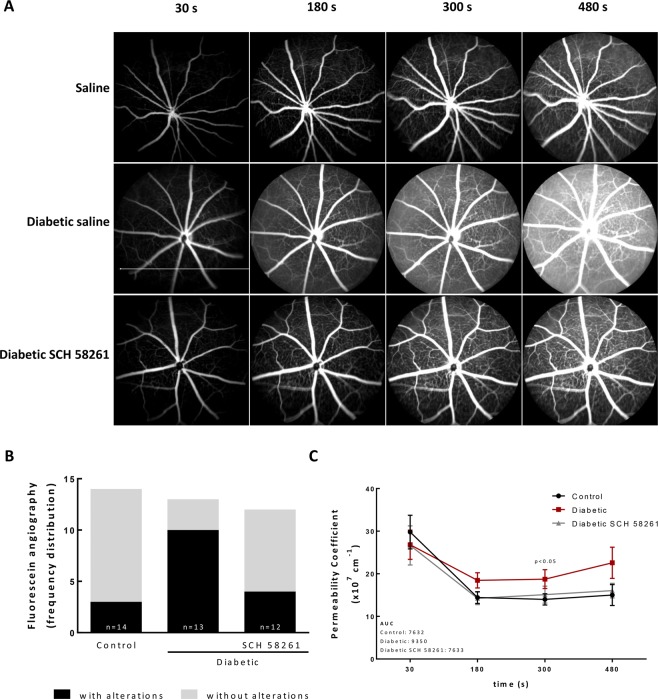
Treatment with A2AR antagonist reduces retinal vascular leakage in diabetic mice. (A) Fluorescein angiography was performed after intraperitoneal injection of 5% fluorescein in control and diabetic non-treated animals or treated with the A2AR antagonist. Images were acquired with the Micron IV (Phoenix Technology) in equivalent time frames. The images represent the distribution of fluorescein across the retina, acquired 30 seconds, 180 seconds, 300 seconds and 480 seconds after injection. (B) The images were classified for the presence or absence of extravasation of fluorescein by 3 independent researchers and the frequency of retinas with and without fluorescein leakage was expressed in percentage of total animals. (C) Permeability coefficient obtained by the quantification of the fluorescence between a major vessel and the interstitial space over time. The area under the curve (AUC) of the permeability coefficient is presented in the graph insert for the different experimental conditions. Permeability coefficient was analyzed with two-way ANOVA using Fisher’s LSD test.

