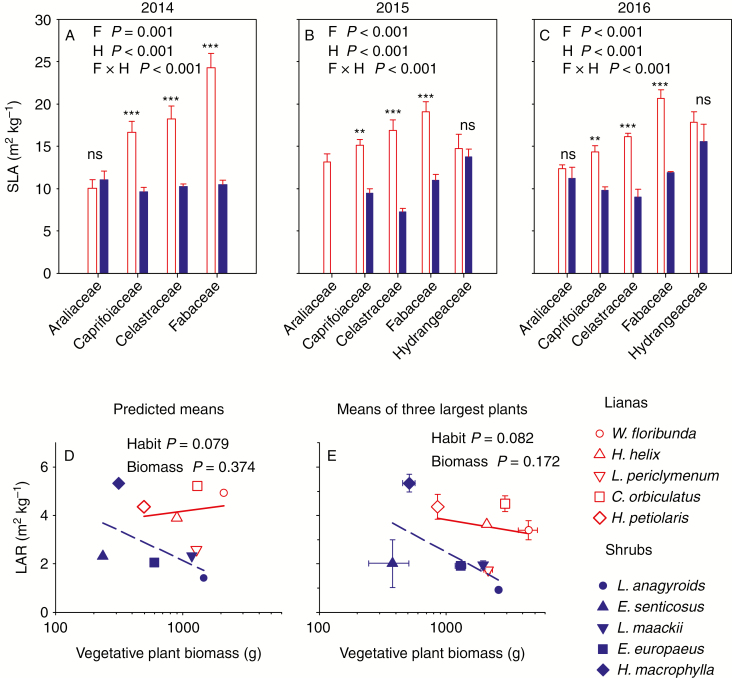
Fig. 2.
Biomass allocation to leaf area in five con-familiar pairs of liana/shrub species. (A–C) Specific leaf area (SLA; means ± s.e.) determined for randomly selected leaves representing various positions throughout the canopy at (A) 2014, (B) 2015 and (C) 2016 harvests. ANOVA results with family (F) and habit (H) effects are given for each harvest, and significance levels for contrasts between species within family are shown above the bars (***P < 0.001; **P < 0.01; *P < 0.05; ns, not significant). (D and E) Relationships between plant leaf area ratio (LARveg) and plant vegetative biomass. Symbols in (D) are predicted species means at average biomass, and symbols in (E) represent means (± s.e.) of the three largest plants per species, and results of ANCOVA are shown. Bold font indicates the effects with P < 0.05.

