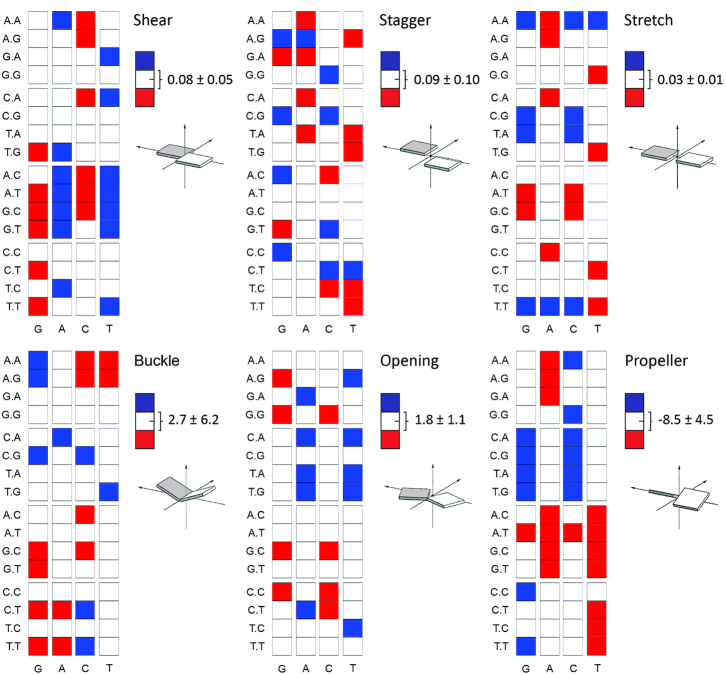
Figure 2.
Average values of intra-basepair helical coordinates of the central base-pair (x-axis) in all possible 64 trinucleotide sequence contexts (y-axis). Results obtained from the miniABCBSC1-K simulations. The global averages (white) are over all sequence contexts and standard deviations reflect the variation among trinucleotide contexts. The blue squares mean that a specific base-pair has an average value above the global average plus one standard deviation, while red squares mean an average value below the global average minus one standard deviation.

