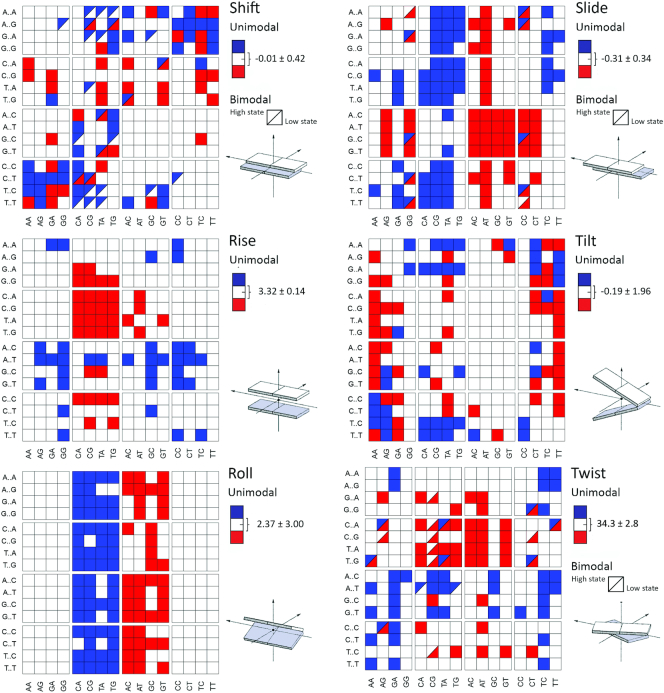
Figure 3.
Average values of inter-basepair, or step, helical coordinates for the central junction (x-axis) in all possible 256 tetranucleotide contexts (y-axis). Results obtained from the miniABCBSC1-K simulations. Tetranucleotides classified as bimodal (half-square) are polymorphic (i.e. they sample two clear conformational substates). The global averages (white), exhibited on the legend at the right of each squared-plot, were computed from the weighted-averages obtained through BIC (see Materials and Methods and Supplementary Methods), and while the standard deviations reflect the variation among the tetranucleotide sequences that share the same central basepair step. The blue squares mean that a specific step has an average value above the global average plus one standard deviation, while red squares mean an average value below the global average minus one standard deviation.

