Figure 4.
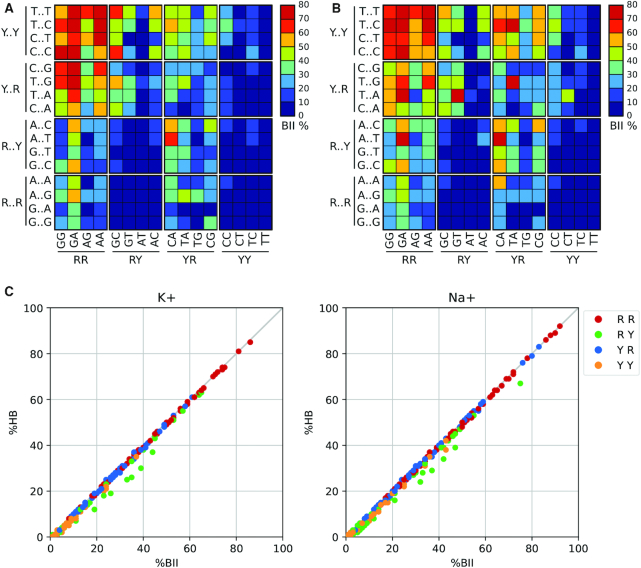
Sequence dependence of BII backbone conformations comparing K+ and Na+. (A) miniABCBSC1-K BII percentages. (B) miniABCBSC1-Na BII percentages. (C) Correlation between the percentage of BII (%BII, horizontal axis) and the occurrence of formation of the C–H···O H-bonds (%HB, vertical axis) at the central base step of each of the 256 possible tetranucleotide sequences, colour-coded according to the base type of the central base step.

