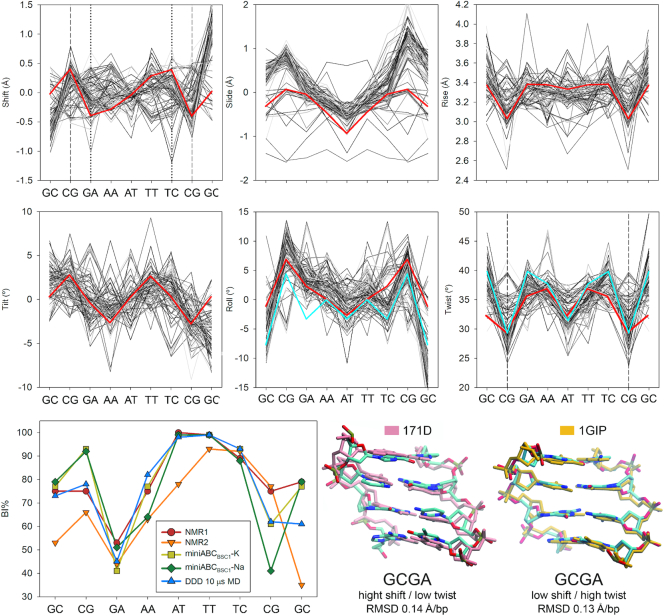
Figure 6.
Comparison between experimental structures (X-ray and NMR) determined for the Drew−Dickerson Dodecamer (9), and conformations predicted by using the MD datasets produced herein. The six intra-basepair parameters were predicted (red lines) and compared with all the experimental structures (gray lines) and Calladine–Dickerson prediction for Roll and Twist (cyan line). Vertical dashed lines represent predicted binormal/bimodal steps, while vertical dotted lines represent steps with clear multi-peaked distributions although not bimodal according to Helguerro (see Materials and Methods). In the last row, predicted BI% (yellow and green) were compared with 31P-NMR gold-standard measurements and multi-microsecond long MD simulation of the same sequence using PARMBSC1 force field (9). NMR1 stands for the work by Schwieters et al. (74), and NMR2 from Tian et al. (68). 3D superposition showing the capability of the miniABC library and our set of rules to predict two conformational substates observed experimentally for DDD at the highly polymorphic GCGA tetranucleotide (NMR structures with PDB id: 171D, and 1GIP). The RMSD was measured after aligning the backbones between the experimental structures and the two substates captured by the miniABC library.

