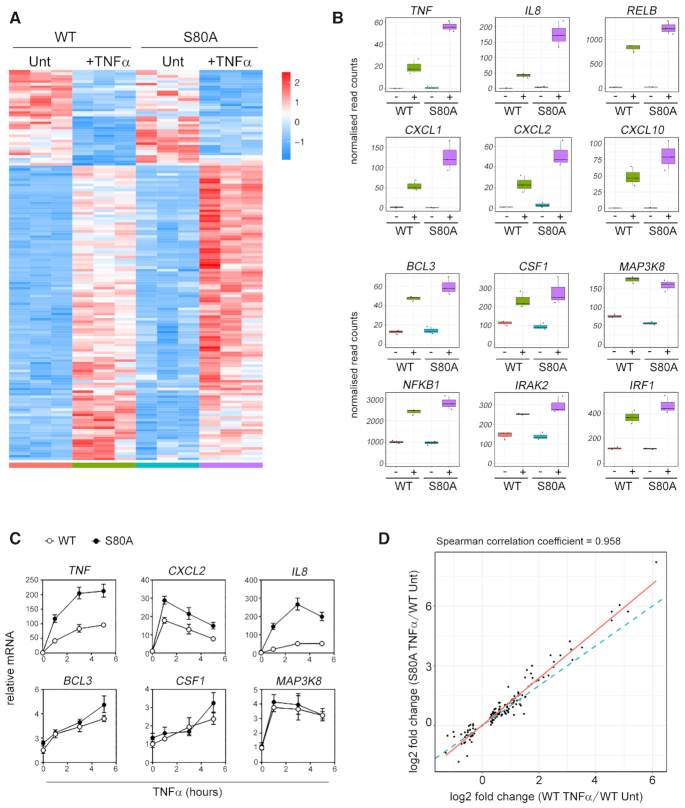
Figure 4.
S80 phosphorylation selectively regulates TNFα-induced gene expression. (A) Triplicate samples of WT and NFKB1S80Acells treated with TNFα for 3 h (+TNFα) or untreated (Unt) were analysed by RNA-seq. The heat map displays differentially expressed genes (Padj <0.05) scaled as per z-score. Genes were clustered using spearman distances and UPGMA agglomeration. (B) Box and whisker plots of gene expression level by RNA-seq for selected genes. Each dot represents a sample. Boxes show the 25th, 50th and 75 percentile with whiskers showing inter-quartile range. Untreated = -; TNFα treated = +.(C) WT and NFKB1S80A HEK293Ts were stimulated with 10 ng/ml TNFα for the indicated times prior to harvest and RNA extraction. Gene expression levels were determined by quantitative real-time PCR. Data are mean ± S.E of triplicate samples and are representative of three independent experiments. (D) Log2 fold change scatter plot of genes (dots) shown in (B). The blue dotted line indicates correlation the between WT TNFα/WT Unt v S80A 0hr/WT Unt fold changes (spearman correlation ∼0.96). The red line represents linear regression. Data are mean of three independent experiments.

