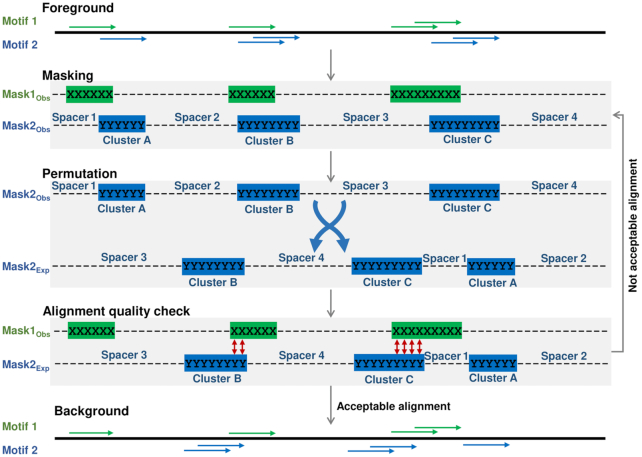
Figure 2.
MCOT permutation procedure. ‘Foreground’ shows profiles of hits for two motifs, green and blue colors mark fixed and selected for permutation profiles. ‘Masking’ partitions each profile onto ‘clusters’ of hits and spacers. ‘Permutation’ shows a real (top) and shuffled (bottom) orders of clusters and spacers. ‘Alignment quality check’ illustrates the checkpoint of permutation. ‘Background’ shows the result of permutation.

