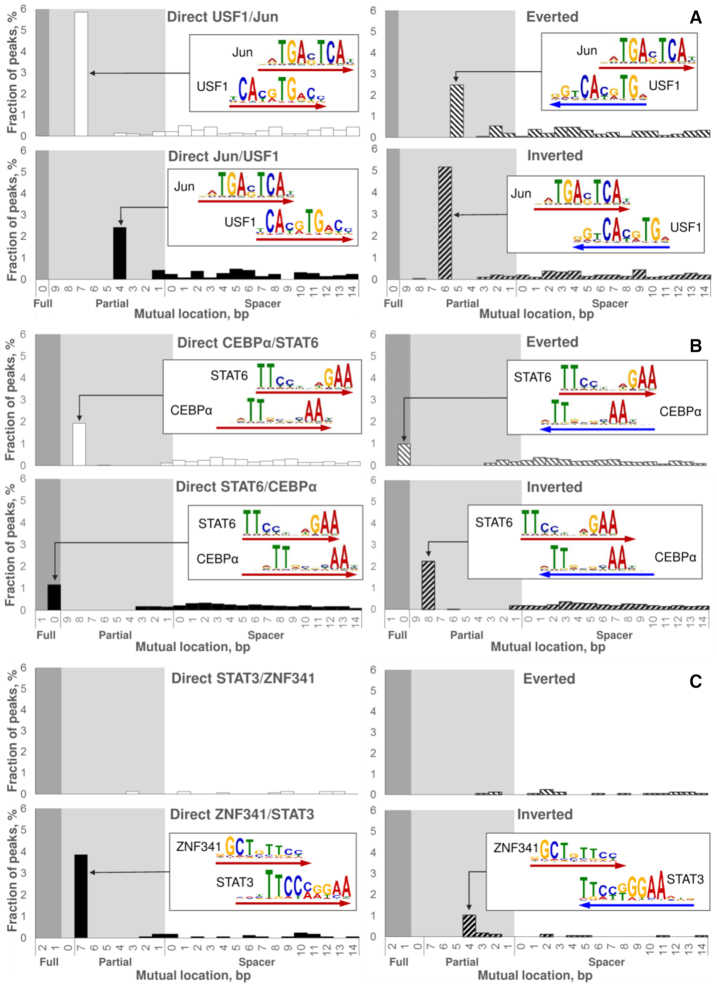
Figure 4.
Examples of predicted CEs. The reciprocal analysis of two ChIP-seq datasets: fine structure of Jun/USF1 CEs (A); novel CEs STAT6/CEBPα (B). Analysis of a single ChIP-seq dataset: novel CEs ZNF341/STAT3 (C). Here we represent the analysis of Jun (A) and STAT6 (B) peaks, the respective reciprocal datasets of USF1 and CEBPα peaks we provided in Supplementary Figures S4 and S8. In reciprocal analyses (A, B) we derived partner motifs from the de novo motif search (17) in a ChIP-seq dataset for the respective TF; analysis of a single ChIP-seq dataset (C) meant extraction of a partner motif from the Hocomoco database (30). In each panel, four charts respect to four mutual orientations of motifs within CEs (Figure 1B), the logo alignment and the arrow point to the most abundant CE variant for each orientation. Axes X denote mutual locations of two motifs (Figure 1C), the ranges of full/partial overlaps and spacers are marked with dark/light grey and white backgrounds. Axes Y denote the fraction of peaks that contains potential CE with a specific mutual location and orientation.

