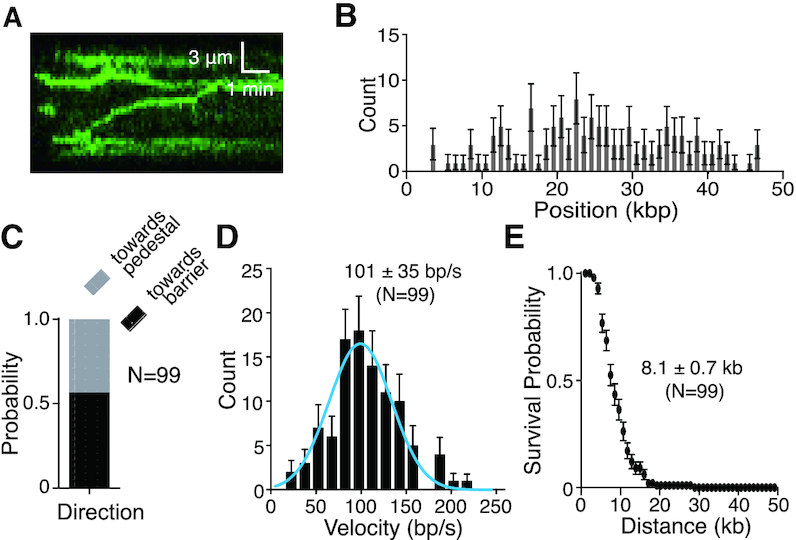
Figure 3.

GFP–BLM translocation on dsDNA with unlabeled RPA. (A) Kymograph showing GFP–BLM (0.2 nM; green) translocation on dsDNA (unlabeled) in the presence of 1 nM unlabeled RPA; note that buffer flow was OFF during data collection. (B) Distribution of initiation sites for GFP–BLM in the presence of 1 nM unlabeled RPA (N = 132). Error bars represent 95% confidence intervals calculated from bootstrap analysis. (C) Quantification of GFP–BLM translocation direction in the presence of 1 nM unlabeled RPA. (D) Velocity distribution of GFP–BLM translocation in reactions with 1 nM unlabeled RPA on double-tethered dsDNA. The solid blue line represents a Gaussian fit to the data. Error bars represent 95% confidence intervals calculated from bootstrap analysis. (E) Survival probability plot of GFP–BLM translocation with 1 nM unlabeled RPA on double-tethered dsDNA. Error bars represent 95% confidence intervals calculated from bootstrap analysis.
