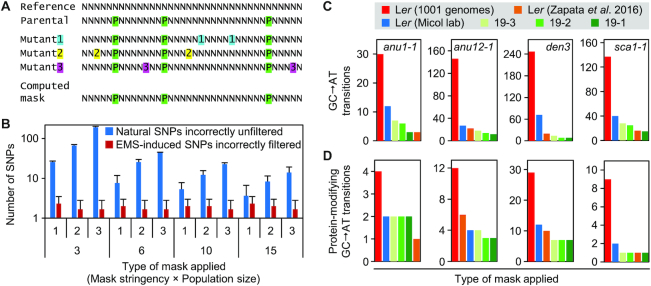
Figure 2.
SNP calling in non-reference genomes. (A) Procedure used to create a natural (parental) SNP mask by integrating the data from different mutants obtained from the same mutagenesis (see also Supplementary Figure S3). N indicates any nucleotide. Nucleotides represented by a P shaded in green are SNPs between the reference sequence (Reference) and the sequence of the line that was subjected to mutagenesis (Parental). Nucleotides shown as 1, 2 and 3 (shaded in blue, yellow and magenta, respectively) are specific of each mutant line and are absent from the genomes of other mutants or the reference and parental lines. The computed mask only includes the SNPs shaded in green. (B) Effect of masking natural SNPs with different population sizes (X-axis, bottom) and SNP selection stringencies (minimum number of samples in which the SNPs were detected; X-axis, top) (n = 3). Error bars indicate standard deviation. (C, D) Number of remaining SNPs in the candidate intervals of the anu1-1 (0.216 Mb), anu12-1 (0.754 Mb), den3 (2.539 Mb) and sca1-1 (0.760 Mb) mutants after filtering with different single-sample (red and blue) and multi-sample (green) SNP masks, or direct alignment of the reads to the Ler genome assembly (orange) (28). The Ler (Micol lab) data correspond to the parental line of the mutants analyzed. The multi-sample masks were constructed from 19 sibling mutants and include all SNPs present in at least 3, 2 or 1 samples. (C) Number of all remaining GC→AT transitions. (D) Number of remaining protein-modifying GC→AT transitions.

