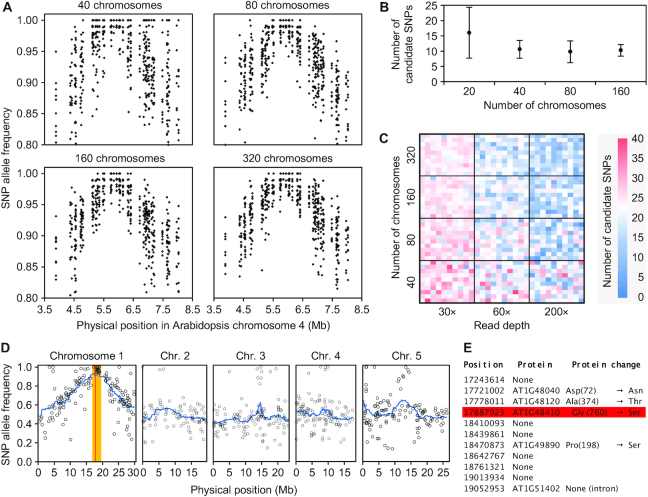
Figure 3.
Mapping-by-sequencing EMS-induced mutations using backcross-derived F2 populations. (A) Variation of SNP allele frequency around the causal mutation after simulating 100× RD reads from mapping populations of different sizes. Each SNP is represented by 10 dots, each corresponding to an experimental replicate. (B) Effect of the number of chromosomes analyzed on the number of candidate SNPs (with an allele frequency ≥ 0.98). Data were computed from 10 simulated replicates of each population size. Error bars indicate standard deviation. (C) Combined effect of mapping population size and sequencing read depth on the number of candidate SNPs. Each heatmap unit represents a single simulated experiment. (D, E) Identification of the ago1-25 mutation using mapping-by-sequencing. (D) Positions and allele frequencies of the SNPs detected in the mapping population. The candidate interval is shown in orange; it is defined based on a cluster of SNPs with allele frequencies ≥0.95. The red line indicates the position of the ago1-25 mutation. (E) Effect of the GC→AT substitutions found in the candidate interval, including the ago1-25 mutation (red square).

